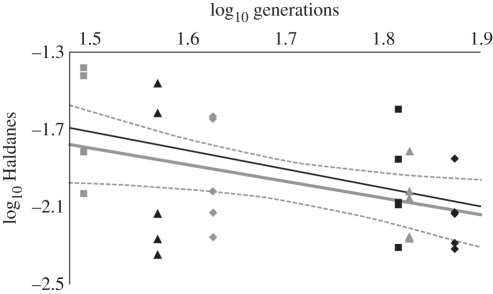
Figure 2.
Evolutionary rates in Haldanes, graphed versus generations for six exotic bird species on the Hawaiian Islands. Each data point represents one morphological character (table 5 for actual rate values). The black line is the trend line taken from Stockwell et al. [43], and is based on other published studies of evolutionary rates. The grey lines represent the trend line and 95% CI for our data. The trend line from Stockwell et al. [43] falls within our 95% CI. Grey squares, Cardinalis cardinalis; black triangles, Zosterops japonicus; grey diamonds, Leiothrix lutea; black squares, Passer domesticus; grey triangles, Lonchura punctulata; black diamonds, Carpodacus mexicanus.

