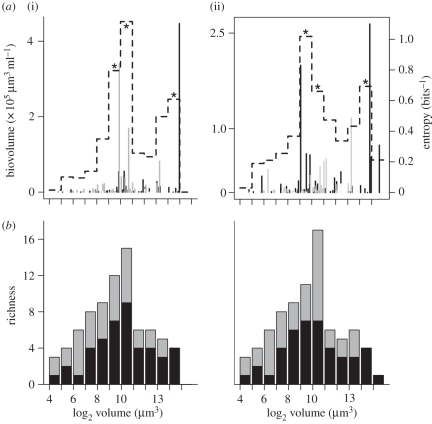
Figure 1.
Phytoplankton size structure and diversity patterns in Laguna de Rocha (i) marine and (ii) limnetic influenced areas. (a) Stems represent species average biovolume and dashed line is the entropy showing clump (*p < 0.05) and gap region (see text for explanation) Grey lines, group V; black lines, group VI. (b) Taxonomic richness against size classes within each morphology-based functional group. Grey bars, group V; black bars, group VI.

