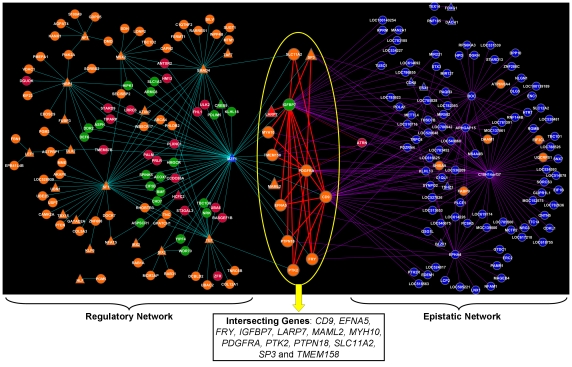
Figure 3. Regulatory and epistatic networks.
Promoter sequence analysis of piebald-associated genes (Table S1) was performed to identify transcription factors (TF; represented by triangles) and build a regulatory network (left panel). Two-loci models for all pairwise comparisons among piebald-associated SNPs were fitted to develop an epistatic network (right panel). The overall landscape revealed the presence of thirteen genes located at the intersection of both networks: CD9, EFNA5, FRY, IGFBP7, LARP7, MAML2, MYH10, PDGFRA, PTK2, PTPN18, SLC11A2, SP3 and TMEM158. Gene color indicates over-expression (red), under-expression (green), unchanged expression (orange) and genes not represented on the microarray (blue) in highly correlated contrasts (DE3, DE5 and DE6). The network file (*.cys) is available on request from the authors to explore within Cytoscape [46].

