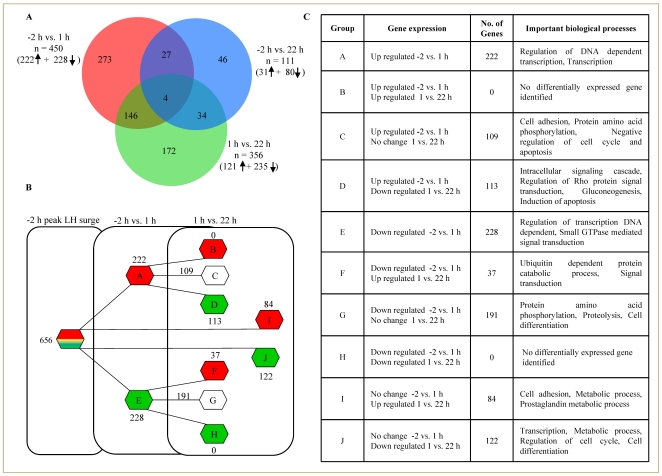
Figure 2. Schematic representation of temporal changes in differentially expressed genes at 1 h and 22 h post peak LH surge.
(A) Venn diagram representing the details of differentially expressed genes identified after microarray analysis of granulosa cells collected from the ovulatory follicle at −2, 1 and 22 h post peak LH surge. Data analyzed with ≥2 fold change cut-off and statistics. The number of differentially expressed genes found common between −2 vs. 1 h (red circle) and −2 vs. 22 h (blue circle) post peak LH surge, as well as comparison of differentially expressed genes between 1 vs. 22 h (green circle) post peak LH surge are presented. (B) Schematic representation of differentially expressed genes at different time points post peak LH surge. Red hexagon represents genes that were up regulated both at 1 and 22 h as well as those genes that were down regulated at 1 h but were up regulated at 22 h time point. Green hexagon represents differentially expressed genes that were down regulated both at 1 and 22 h time points as well as those genes that were up regulated at 1 h but were down regulated at 22 h time point. Also provided is the number of genes (represented as open hexagon) that were differentially expressed at 1 h time point but not at 22 h. (C) The number of differentially expressed genes listed as alphabetical groups in Fig. 2B are further represented in tabular form providing details on the number of genes in each group, pattern of expression change at both time points post peak LH surge as well as classification based on their ontological distribution within each ‘biological processes’ terms having high scores indicative of processes associated with each group.

