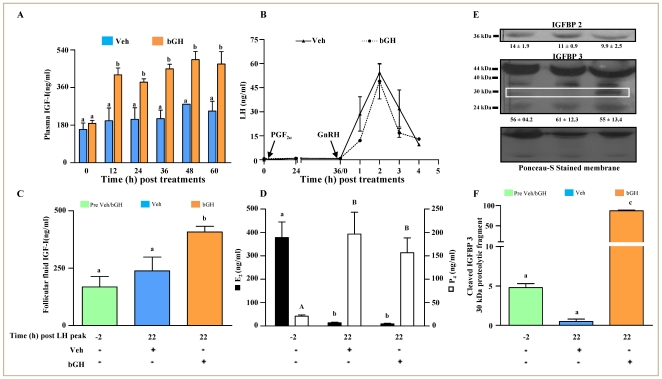
Figure 8. Effects of bGH treatment on IGFBP expression and various hormone concentration.
(A) Circulating plasma concentration (mean ±SEM) of IGF-I in blood samples collected at different time intervals in Veh and bGH treated animals. Bars with different letters above them are significantly different (p<0.05). (B) Serum concentration of LH before and after GnRH administration to induce ovulation in buffalo cows treated with Veh (solid triangle) or bGH (solid circle). Concentration of LH was determined in blood samples collected at various time points before and after administration of GnRH to elicit endogenous LH surge. (C) Concentration of IGF-I (ng/ml) measured in the follicular fluid collected from follicles before (−2 h) and 22 h post peak LH surge of Veh or bGH treated animals. Bars with different letters above them are significantly different (p<0.05). (D) Mean ± SEM concentrations of E2 and P4 in follicular fluid collected from follicles before and at 22 h post peak LH surge of Veh or bGH treated animals. Bars with different alphabets within each hormone indicate significantly different concentration (p<0.05). (E) Protein expression of IGFBP2, IGFBP3 and Cleaved IGFBP3 in the ovarian follicular fluid. Protein lysates (100 µg) prepared from follicular fluid collected from the preovulatory follicle before (−2 h) and 22 h post peak LH surge of Veh or bGH treated animals were resolved on 10% SDS PAGE, transferred onto PVDF membrane and immunoblot analysis was performed using anti-IGFBP2 or anti-IGFBP3 antibody. The positions of 36 kDa IGFBP2 and 44–40 kDa IGFBP3 doublet bands are indicated by arrows and 30 kDa bands of IGFBP3 proteolytic fragment is highlighted in the boxed area. Densitometric values were determined and are indicated as mean ± SEM below the bands. The image of Ponceau-S stained membrane is depicted to indicate that equal amount of protein was loaded in each lane. (F) Densitometric analysis of immunoblots for 30 kDa IGFBP3 proteolytic fragment: mean ± SEM of relative amount of 30 kDa IGFBP3 proteolytic fragment expressed as intensity of Ponceau-S stained bands in each group (n = 3 animals/group). Bars with different letters are significantly different (p<0.05).

