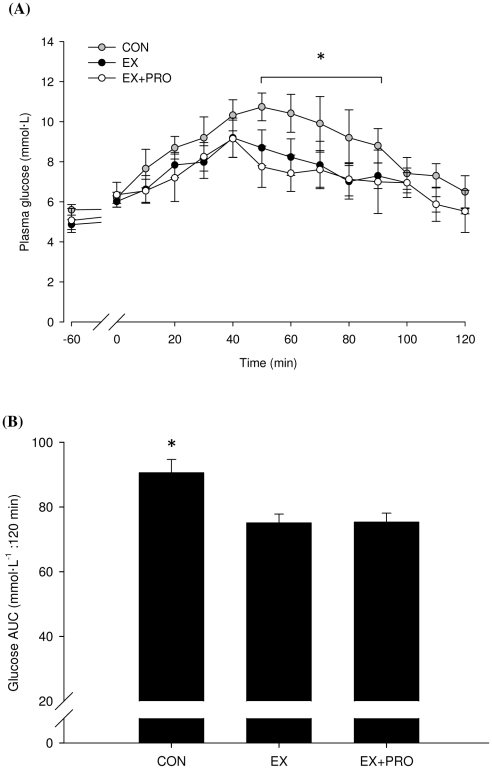
Figure 2. Plasma glucose concentration (A) and AUC (B) during OGTT 24 h following resistance exercise in untrained volunteers.
Groups as per Table 1. Values are means ±SEM; n = 8 per group. *: significantly greater glucose concentration/AUC for CON compared with EX and EX+PRO (P<0.05).

