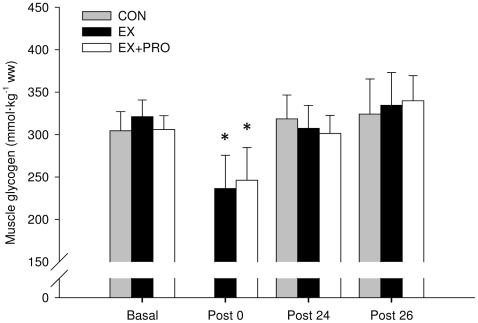
Figure 5. Muscle glycogen content.
Values obtained at basal, immediately post-exercise (Post 0), 24 h post-exercise (Post 24) and immediately following OGTT (Post 26). Groups as per Table 1. Values are means ± SEM; n = 6 per group. *: significantly lower compared with basal (P<0.05).

