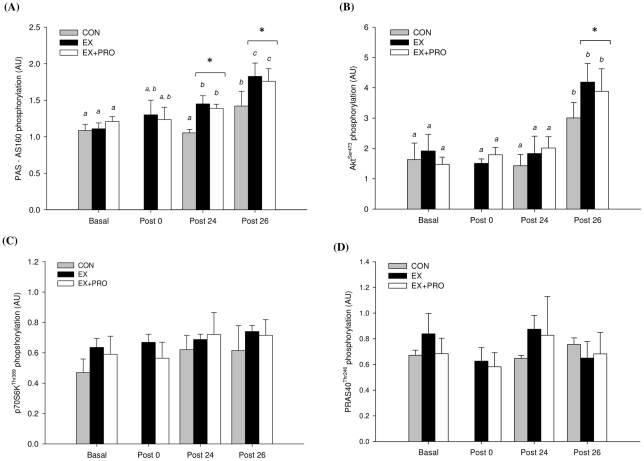
Figure 6. Signalling protein phosphorylation of (A) Aktser473, (B) PAS-AS160/TBC1D4, (C) p70S6KThr389 and (D) PRAS40Thr246 from muscle samples taken at 4 different time points.
Groups as per Table 1. Values are means ± SEM; n = 6 per group. Means with different letters are significantly different from each other (P<0.05). *: significantly lower phosphorylation for CON compared with EX and EX+PRO (P<0.05).

