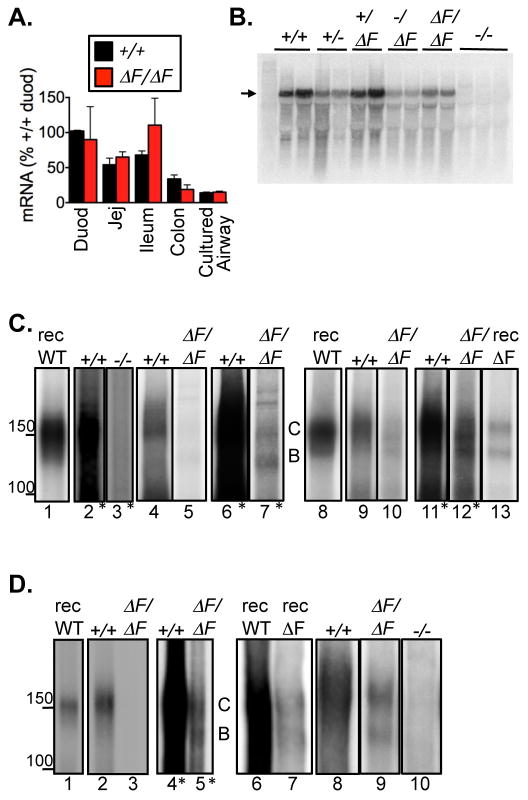
Figure 4. mRNA and protein expression in intestine and airway.
A. Quantitative RT-PCR of CFTR mRNA in CFTRΔF508/ΔF508 and CFTR+/+ pigs. Data are from triplicate assays repeated on multiple days. For each tissue, amounts of CFTR mRNA were normalized to β-actin mRNA. These normalized values were then expressed relative to that in wild-type duodenum. Data are mean±SE from intestinal tissues from 6 CFTR+/+ and 6 CFTRΔF508/ΔF508piglets, and from cultured nasal epithelia from 1 CFTR+/+ piglet (n=3) and 1 CFTRΔF508/ΔF508piglet (n=4).
B. Northern blot analysis of duodenal CFTR mRNA, indicated by arrow.
C. Immunoprecipitated and in vitro phosphorylated CFTR isolated from intestine. “rec” (lanes 1,8,13) indicates recombinant protein. Lanes 2–7, proximal intestine. CFTR+/+ and CFTR−/− 500 μg and CFTRΔF508/ΔF508 750 μg. Lanes marked with * show enhanced exposure. Lanes 6 and 7 are same as lanes 4 and 5. Lanes 9–12, distal intestine. CFTR+/+ 200 μg and CFTRΔF508/ΔF508 1000 μg. Lanes 11 and 12 are same as 9 and 10.
D. Immunoprecipitated and in vitro phosphorylated CFTR isolated from airway epithelia. Recombinant protein, lanes 1,6,7. Lanes 2–5, trachea; CFTR+/+ 623 μg and CFTRΔF508/ΔF508 1208 μg. Lanes 4 and 5 are same as lanes 2 and 3. Lanes 8–10, cultured bronchial epithelia; each lane 750 μg.

