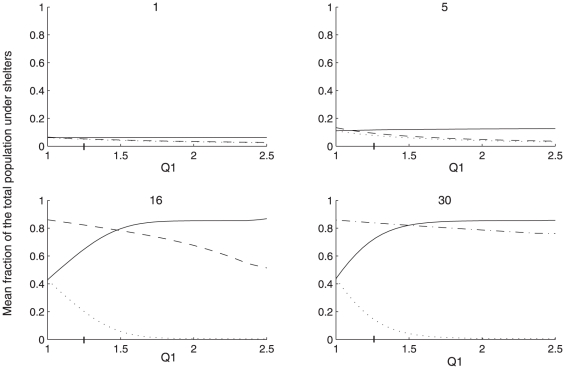
Figure 4. Theoretical results.
Comparison between theoretical fractions of individuals settled in a binary choice (a dark shelter (solid line) and a light one (dotted line)) and in a no choice setup (corresponding to the light shelter (dashed line)) according to Q1. Vertical bars on x-axis represent the experimental Q1.

