Fig. 5.
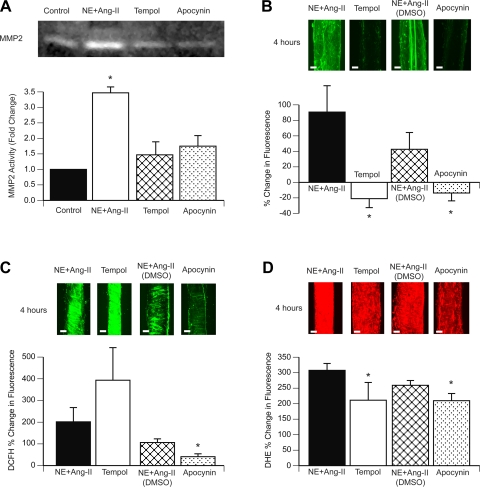
ROS inhibition with apocynin or tempol prevents the activation of MMP-2 induced by prolonged exposure to NE + ANG II. A: pools (n = 3) of control untreated arterioles or arterioles treated with NE + ANG II alone, NE + ANG II + 300 μM apocynin, or NE + ANG II + 250 μM tempol were subjected to gel zymography. Bands were analyzed by densitometry and expressed as fold changes from the untreated control for the activity of the active (64 kDa) form of MMP-2. Contrast was optimized for the best visualization of the bands on the digitized image of the zymogram gel. B: arterioles incubated for 4 h with NE + ANG II alone (n = 4) or in combination with 250 μM tempol (n = 4), 0.5% DMSO (n = 4), or 300 μM apocynin (n = 4) were coincubated with DQ gelatin (10 μg/ml). 3-D images of the arterioles were obtained with a multiphoton microscope every hour for 4 h. Representative 3-D images (bars = 20 μm) of vessels from each treatment at 4 h of incubation are shown. The bar graph represents the percent changes in fluorescence intensity of 3-D images from 5 min to 4 h of incubation. C: arterioles incubated with NE + ANG II alone (n = 4), NE + ANG II + tempol (n = 4), NE + ANG II + DMSO (n = 4), or NE + ANG II + apocynin (n = 4) were coincubated with DCFH (30 μM) and imaged with a multiphoton microscope every hour for 4 h. Representative 3-D images (bars = 20 μm) of each treatment at 4 h of incubation are shown. The bar graph represents the percent changes in DCFH fluorescence intensity from 5 min to 4 h of incubation. D: arterioles incubated with NE + ANG II alone (n = 4), NE + ANG II + tempol (n = 4), NE + ANG II + DMSO (n = 4), or NE + ANG II + apocynin (n = 4) were coincubated with DHE (5 μM) and imaged with a multiphoton microscope every hour for 4 h. Representative 3-D images of each treatment at 4 h of incubation are shown. The bar graph represents the percent changes in DHE fluorescence intensity from 5 min to 4 h of incubation. All data are means ± SE. *P ≤ 0.05 compared with control.

