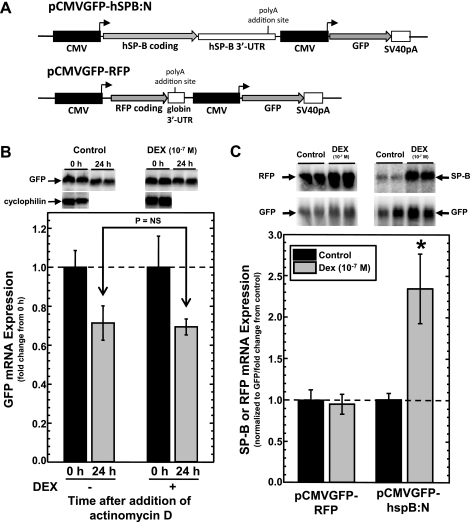
Fig. 1.
Analysis of dexamethasone (DEX)-induced changes in steady-state levels of surfactant protein-B (SP-B) or red fluorescent protein (RFP) mRNA in A549 cells transfected with pCMVGFP-hspB:N or pCMV-GFP-RFP, where CMV is cytomegalovirus and GFP is green fluorescent protein. A: schematic of pCMVGFP-hspB:N and pCMV-GFP-RFP plasmid shown in scale. Black boxes represent identical, independent CMV E1 promoters; arrows denote the direction of transcription. Gray arrows represent the coding regions for human SP-B (hSP-B), RFP, and GFP. Hatched boxes represent the SP-B mRNA 3′-untranslated region (hSP-B 3′-UTR), rabbit β-globin 3′-UTR (globin 3′-UTR) and the SV40 large T antigen mRNA 3′-UTR (SV40pA). The positions of the polyadenylation signals are indicated. B: analysis of GFP mRNA stability in A549 cells. Cells were transfected with pCMVGFP-hspB:N and incubated in the absence or presence of DEX (10−7 M) and then treated with actinomycin D (10 μg/ml) for 24 h. RNA was isolated at time = 0 and 24 h and subjected to Northern analysis for the presence of GFP mRNA and cyclophilin mRNA (for use as a loading control, only at t = 0 h). Shown is a typical image of the analysis generated by phosphorimaging. Levels of GFP mRNA at t = 0 h were set as 1 and normalized GFP levels (means ± SE) at 24 h relative to levels at t = 0 h are shown (N = 6, 2 independent experiments). C: effect of DEX on steady-state levels of SP-B and RFP mRNA in A549 cells. Cells were transfected with pCMVGFP-RFP or pCMVGFP-hspB:N and incubated in the absence or presence of DEX (10−7 M). RNA was isolated and subjected to Northern analysis for the presence for SP-B, RFP, or GFP mRNA. Shown is a typical image of the analysis generated by phosphorimaging. The RFP mRNA/GFP mRNA or SP-B mRNA/GFP mRNA ratio was determined in each sample. The average ratio in untreated samples was set as 1; the ratio from DEX-treated samples was normalized to this average. Shown are normalized SP-B levels (means ± SE) in DEX-treated samples relative to levels in untreated samples (N ≥ 10, 3 independent experiments; *P < 0.01).

