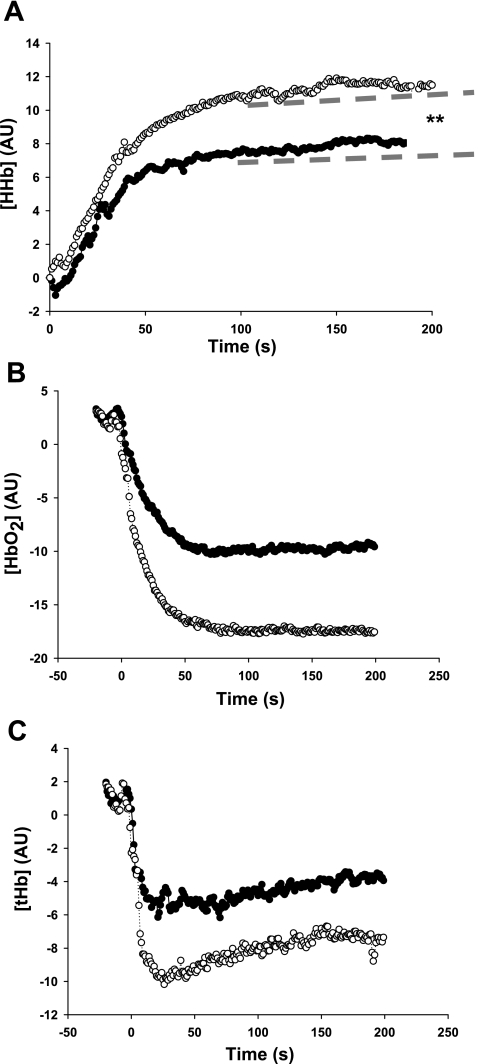
Fig. 3.
Group mean changes in the parameters of gastrocnemius muscle oxygenation measured by near-infrared spectroscopy during a maximal CPX following PL (○) and BR (●) beverage. The data represent 2 stages of the maximal CPX test (grade increased at 120 s). The average data are only shown up to 200 s, as this is the point at which some subjects reached PWT and had to stop. The dotted lines represent the difference in peak amplitude change for the fitted curve of (A) deoxyhemoglobin concentration [HHb] on data from stage 1 only, (B) oxyhemoglobin concentration [HbO2], and (C) total hemoglobin concentration [tHb]. Error bars are not shown for clarity (see Table 1 for further details). AU, arbitrary units. **significantly different from PL group, P ≤ 0.01.

