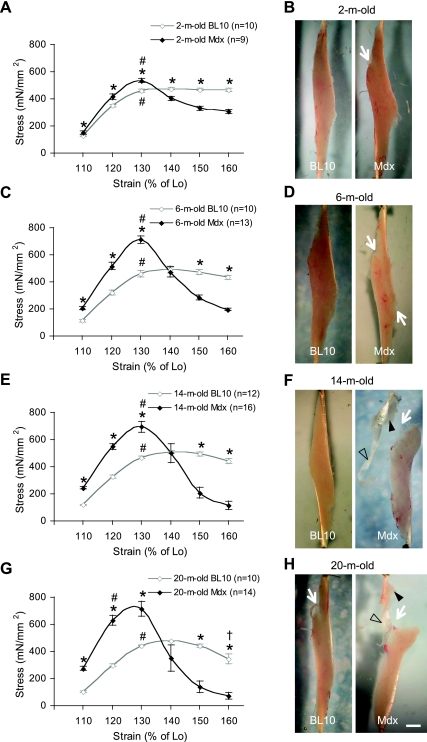
Fig. 1.
Age-matched comparison of the extensor digitorum longus (EDL) muscle stress-strain curves in BL10 and mdx mice. A, C, E, and G depict the stress responses to the strains of 110–160% of muscle optimal length (Lo) at the rate of 2 cm/s. *Stresses developed in mdx muscles significantly different from those of aged-matched BL10 at the same strain. #Strain at which the peak stress was generated. †Stress developed at 160% of Lo significantly different from that at 150% of Lo in 20-mo-old BL10 mice. At the end of the passive stretch protocol, macroscopic images of the muscle were obtained. B, D, F, and H are the representative muscle images at ages of 2, 6, 14, and 20 mo, respectively. In each panel, the BL10 muscle image is on the left side and the mdx muscle image is on the right side. The scale bar (1 mm) applies to all images. White arrows indicate the position of the muscle failure. Filled arrowheads indicate residual muscle attached to the tendon. Open arrowheads indicate the region of the tendon that is completely separated from the muscle.

