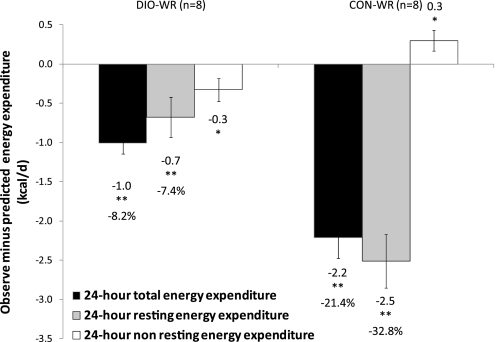
Fig. 3.
Means ± SE. Observed-minus-predicted 24-h total (black bars), 24-h resting (grey bars) and nonresting (white bars) energy expenditure (EE; kcal/24 h). Predicted values obtained by multivariate regressions relating 24-h total [total EE (TEE) = 5.16 + 0.34 * fat-free mass (FFM) + 0.06 * FM], 24-h resting EE (REE = 4.96 + 0.17 * FFM + 0.14 * FM) or non-REE (NREE = 0.20 + 0.18 * FFM − 0.08 * FM) EE with FFM and FM of AL-fed mice (DIO-AL + CON-AL). *P < 0.05, **P < 0.01, t-test of residuals vs. 0.

