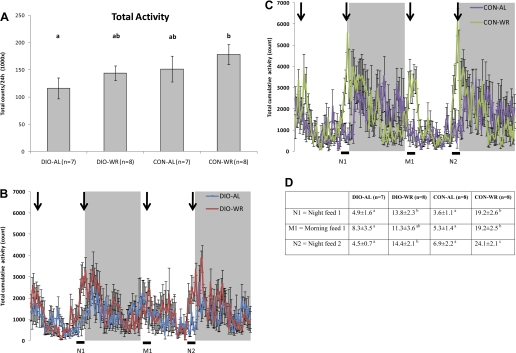
Fig. 4.
A: means ± SE 24-h ambulatory movement beam breaks (sequential breaking of two adjacent x- or y-beams). B and C: total cumulative ambulatory activity for each 14-min period. N, night; M, morning. Black bars at bottom are 1-h periods prior to feeding WR mice that are quantified in D. D: cumulative ambulatory activity for 1-h time period prior to feeding of WR mice (1,000 × beam breaks ± SE). Arrows represent the times at which the weight-reduced animals were fed. Data not marked by same letter are significantly different by two-way ANOVA with Tukey post hoc analysis.

