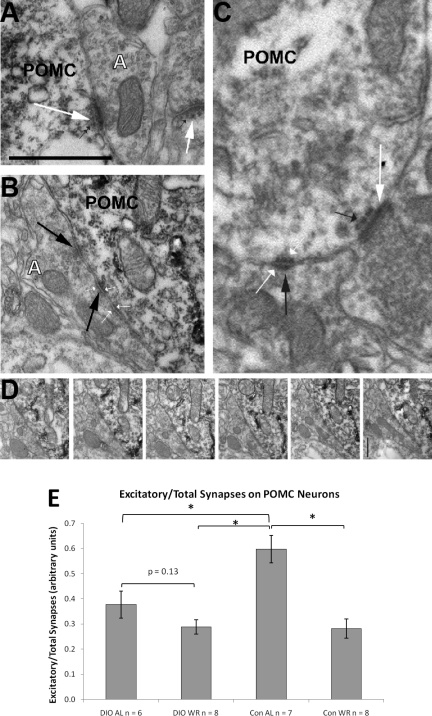
Fig. 5.
A: sample of electron microscopy image showing asymmetrical/excitatory connections (large white arrows) onto proopiomelanocortin (POMC) cell body and unlabeled dendritic spine. Small black arrows point to an electron dense band below the postsynaptic membrane specialization, a characteristic sign of asymmetrical, excitatory synapses. B: sample of electron microscopy image showing a symmetrical/inhibitory connection onto POMC cell body (large black arrows). Small white arrows point to both pre- and postsynaptic thickening of the membranes typical of symmetrical synapses. C: an electron micrograph showing an asymmetrical (large white arrow) contact and a symmetrical contact (large black arrow) on a POMC-immunolabeled (light immunoperoxidase in cytosol) dendrite. Small black arrow points to the specialization below the postsynaptic density of the asymmetrical contact. Small white arrows point to both pre- and postsynaptic thickening of the membranes typical of symmetric synapses. D: consecutive serial sections of the symmetrical contact shown on B. Note that no electron dense band (a characteristic of asymmetrical, stimulatory synapses) ever appears below the postsynaptic density. Bar, xxx. E: mean ratio excitatory/total synapses on POMC cell bodies in the arcuate nucleus (arbitrary units ± SE): *P < 0.05. White A in panel A and B mark axon terminals. Bar scale on A represents 1 μm for A and B and 0.5 μm for C and D.

