
Fig. 6.
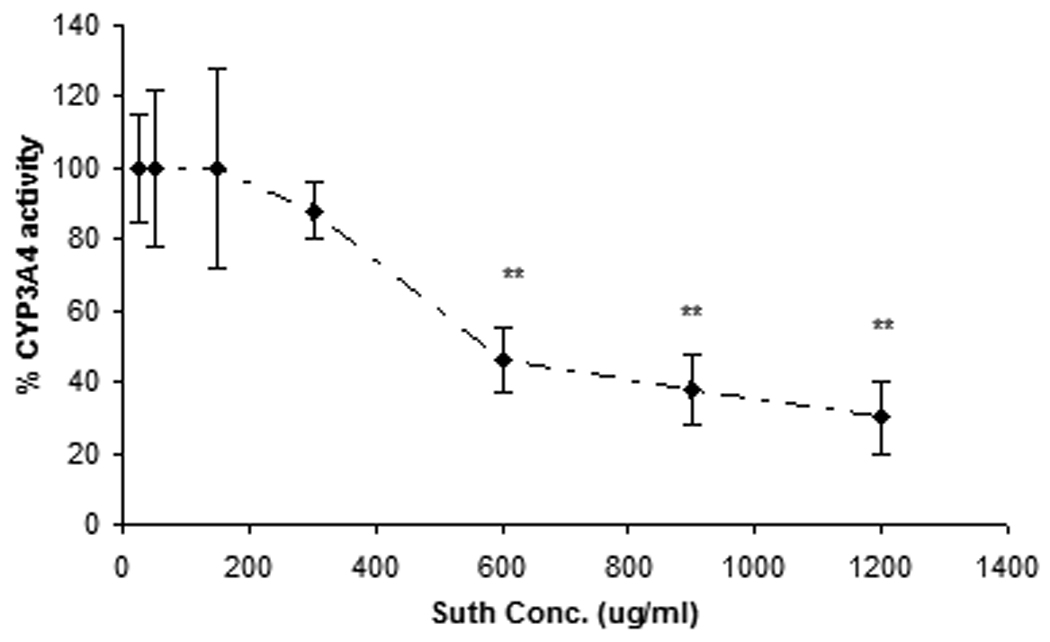
Vivid assay for determining the CYP3A4 inhibitory potency: Concentration-response curve shows the % of CYP3A4 activity in presence of increasing concentrations (25µg/mL–1200µg/mL) of sutherlandia. Each data point represents mean ± S.D. (n = 7), (**) represents significant difference from control (p < 0.01).