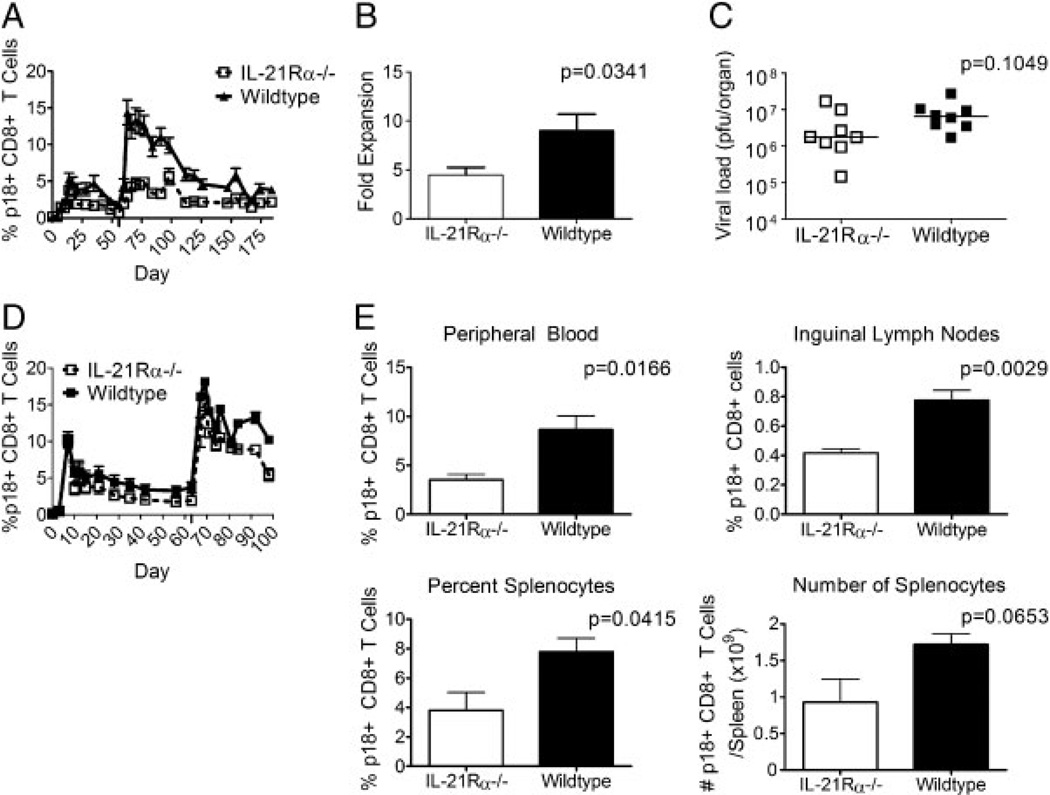
Figure 3.
IL-21Rα−/− mice generate reduced antigen-specific secondary CD8+ T-cell responses to virally encoded antigens. (A) WT and IL-21Rα−/− mice were inoculated with rAd-gp140 and then re-inoculated with rAd-gp140 eight weeks later and p18-specific CD8+ T cells were quantitated with an H-2Dd/p18 tetramer. Data are presented as the percentages of CD8+ T cells that bind tetramer and represent the means of six mice per group ± SE and are representative of four experiments. (B) The fold increase of cells undergoing secondary expansion after secondary rAd-gp140 inoculation was calculated by dividing the tetramer percentage for each mouse at the peak time point by the tetramer percentage for the same mouse at the day of boost. Data represent the means ± SE of six mice per group and are representative of four experiments. (C) CD8+ T cells from rAd-gp140 primed WT or IL-21Rα−/− mice were transferred into Nude/SCID mice and then reconstituted mice were challenged intranasally with rVac-gp160. Plaque forming units in the ovaries of these mice were quantitated 6 days after challenge. (D) WT and IL-21Rα−/− mice were inoculated with rVac-gp160 and then re-inoculated with rVac-gp160 nine weeks later. p18-specific CD8+ T cells in the peripheral blood of individual mice were quantitated with an H-2Dd/p18 tetramer. Data are presented as the percentages of CD8+ T cells that bind tetramer and represent the means of six mice per group ± SE and are representative of two experiments. (E) WT and IL-21Rα−/− mice were inoculated with rAd-gp140 and then re-inoculated with rAd-gp140 eight weeks later and then sacrificed 21 days post-secondary inoculation. Lymphocytes were isolated from peripheral blood, inguinal lymph nodes, and spleen, and p18-specific CD8+ T cells of individual mice were quantitated with an H-2Dd/p18 tetramer. Splenocytes from individual mice were counted to allow enumeration of the number of tetramer-positive cells per mouse. Data represent the mean ± SE of four mice per group and are representative of three experiments. The Mann–Whitney test was used for statistical comparisons.

