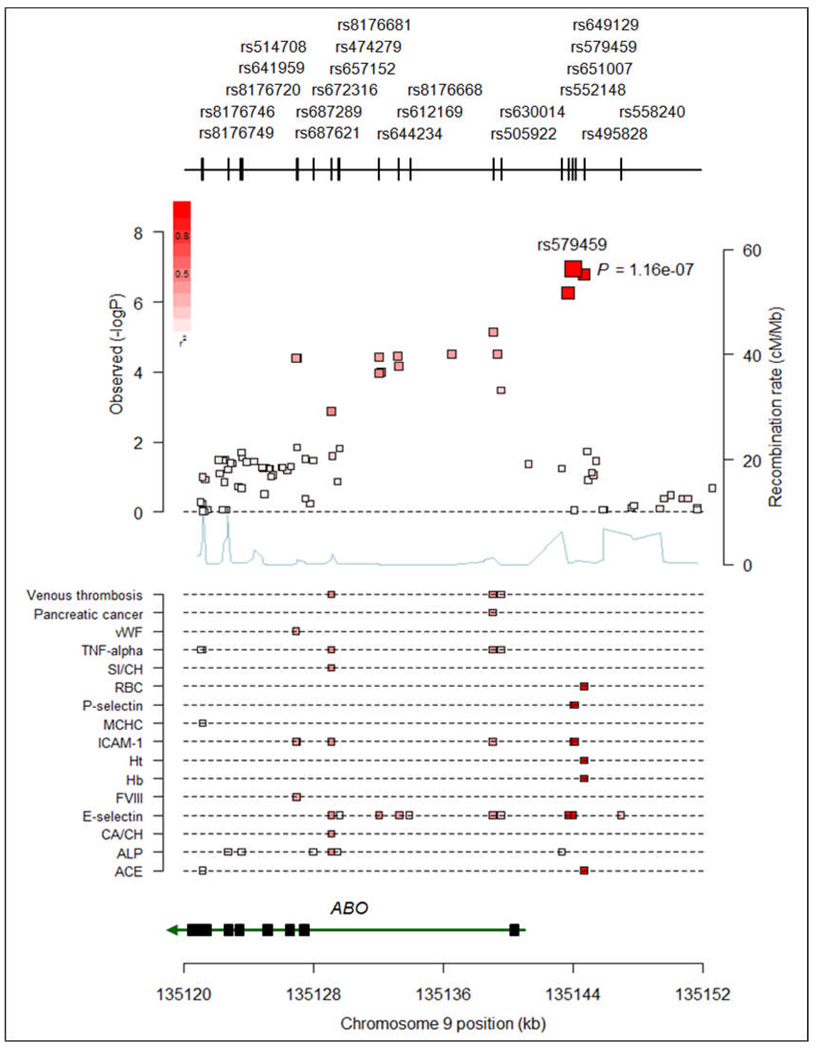
Figure 2. Example of overlapping association signals for multiple traits at ABO gene region on chromosome 9q34.
In the upper panel the association signal for coronary disease at the ABO gene region in CARDIoGRAM and the positions and rs-numbers of SNPs in this region are shown. The size of boxes illustrates the number of individuals available for this respective SNP. In the lower panel all SNPs with P-values at genome-wide significance level of P<5×10⁻⁸ based on the NHGRI GWA study catalogue (http://www.genome.gov/gwastudies/; accessed on June 28th 2010) for all diseases and traits are shown. The degree of linkage disequilibrium (r2) between the lead SNPs for coronary disease and the other traits is reflected by the colour of the squares (upper panel) and the small bars (lower panel) (dark red (high LD) > faint red (low LD)). SI/CH = sitosterol normalized to cholesterol; CA/CH = campesterol normalized to cholesterol; ALP = alkaline phosphatase; ACE = angiotensin converting enzyme; FVIII = coagulation factor VIII; vWF = von Willebrand Factor.

