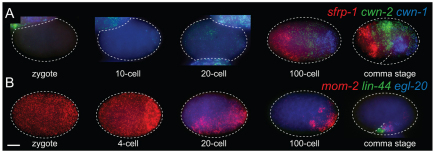
Fig. 2.
Single molecule mRNA FISH analyses of the C. elegans Wnt genes and sfrp-1 during embryonic development. Images are maximum intensity projections of lateral z-stacks. Detection of (A) sfrp-1, cwn-1 and cwn-2, and (B) mom-2, lin-44 and egl-20 transcripts. Embryos were staged using DIC microscopy and DAPI staining of nuclei. Scale bar: 10 μm.

