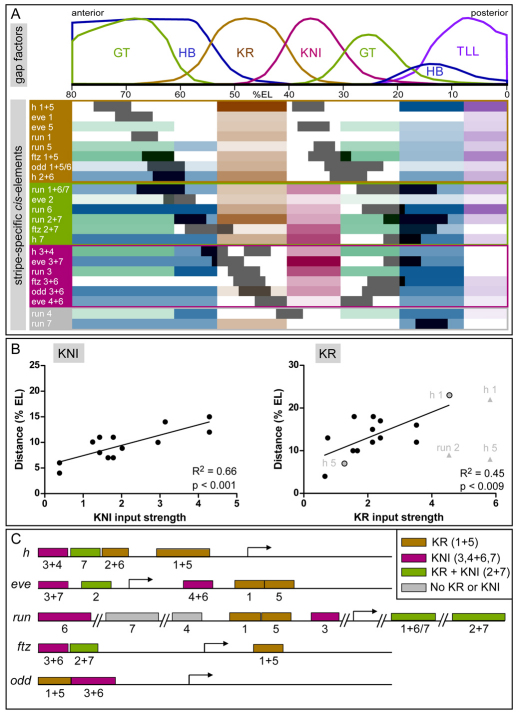
Fig. 6.
Binding site composition and genomic organization of stripe-specific cis-elements. (A) The spatial correlation of cis-element expression domains (dark gray) with the repressive gap factor input they receive. HB, blue; KR, brown; KNI, magenta; GT, green; TLL, purple; the strength of input is represented by the color intensity. Elements are grouped according to the central gap factors that provide the dominant repressive input. Expression patterns of gap factors are shown above [FRDWT 10% strip, time class 14A 4, data from Myasnikova et al. (Myasnikova et al., 2001)]. (B) Scatter plots showing the relationship between strength of predicted input (x, Stubb integrated profile value) and distance from the center of the gap factor domain to the proximal stripe border (y; % EL, percentage egg length). The results of linear regression analysis are indicated. The data points for the full h 1+5 element and the run 2+7 element are shown in gray, and for the separable h stripe 1 and 5 elements in gray with a black border. (C) Genomic organization of stripe-specific cis-elements within the pair-rule gene loci, with color-coding based on the classification shown in A. See also Fig. S2 and Tables S1, S2 and S3 in the supplementary material.

