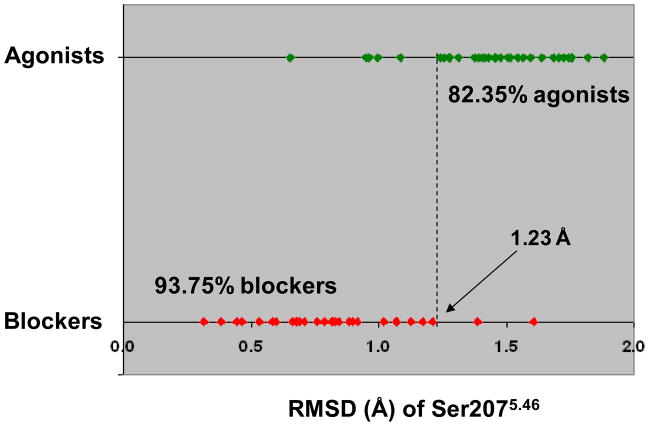
Figure 4.
Plot of the average RMSD induced by the docked ligands to Ser2075.46: a demarcation line at 1.23 Å correctly classifies 82.35% of the agonists and 93.75 % of the blockers. Each dot represents the average RMSD induced by a particular compound. Agonists, defined as the compounds with an intrinsic activity greater than 15% relatively to isoproterenol, are in green, while blockers, defined as the compounds with an intrinsic activity lower than 15% relatively to isoproterenol, are in red. The misclassified agonists are formoterol, salbutamol, broxaterol, sulfonterol, AH-3021 and T-0509. The misclassified blockers are sotalol and (SRRR)-Nebivolol.

