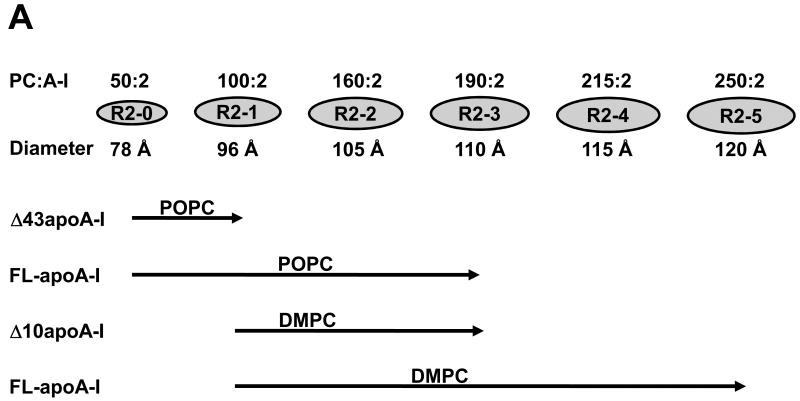
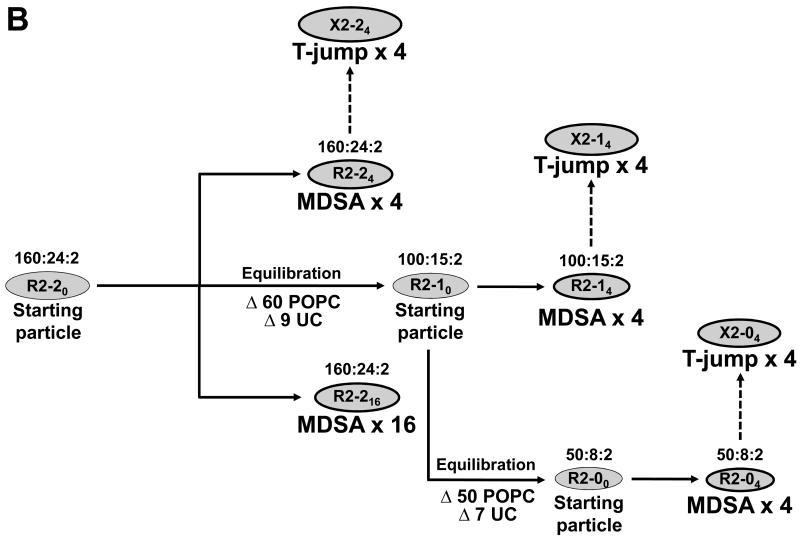
FIGURE 1. Schematics of the creation, characteristics, and modeling of apoA-I/HDL R2 particles.
A. Schematics of the composition and size of apoA-I/HDL R2 particles. B. Flow diagram of the creation of the different R2 particles and ensembles by MD, MDSA (30 ns total simulation time), and T-jump (20 ns total simulation time).


