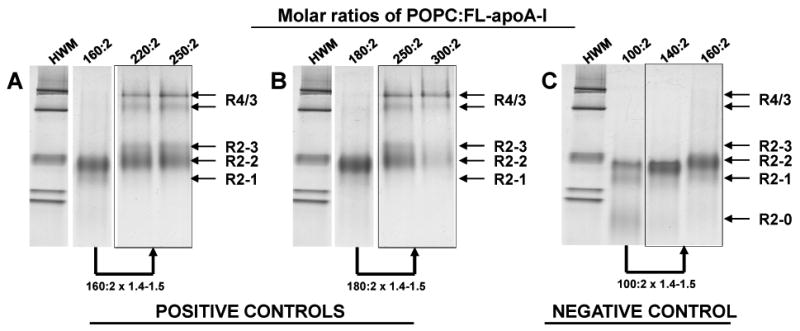
FIGURE 3. Effects of POPC concentration on particle size distribution of POPC:FL-apoA-I recombinants.

The gels (4-20% polyacrylamide) were run for 48 hrs and stained with colloidal blue. NDGGE of reconstituted particles having POPC:FL-apoA-I molar ratios of: (positive controls) A. 160:2, 220:2 and 250:2; B. 180:2, 250:2 and 300:2; and (negative control): C. 100:2, 140:2 and 160:2. Fusion products are represented by the R4/3 bands.
