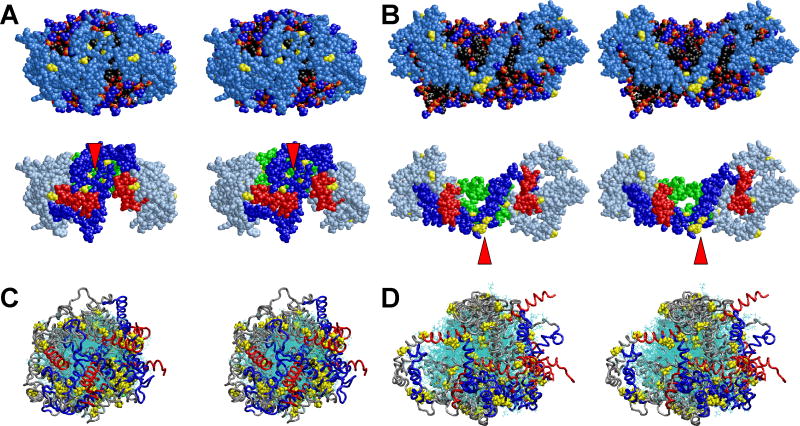
FIGURE 5. Cross-eyed stereo images of structural features of the four MDSA and four 500 K MD T-jump simulations of the 100:15:2 (R2-1) and 50:8:2 (R2-0) particles.
A. Final structure of one example from the ensemble of four MDSA simulations (R2-14) of the R2-1 particle. B. Final structure of one example from the ensemble of four 500 K MD T-jump simulations (X2-14) of the R2-1 particle. (Top panels) Spacefilling models, excluding hydrogens, viewed from the terminal overlap domain side of the particles. Protein: Skyblue except proline (yellow). POPC: Phosphorous atoms (gold), phosphate oxygen atoms (red), choline nitrogens and methyls (blue), acyl chains (black). UC: (cpk). The white arrowheads indicate areas of exposure of acyl chains to solvent. (Bottom rows) Same view as top row with protein in ribbon representation, except for prolines (yellow spacefilling) and POPC and UC in line representation. Protein: Gray except proline (yellow), N-terminal G* domain, residues 1-43 (blue), C-terminal helix 10, residues 220-243 (red), helix 5, residues 121-142 (green) visible behind the POPC bilayer. The red arrowheads indicate clustering of the N-terminal proline-rich pairs. C. All the final structures from the ensemble of four R2-0 MDSA simulations (R2-04) aligned at residues 77 to 188. D. All the final structures from the ensemble of four R2-0 500 K MD T-jump simulations (X2-04) aligned at residues 77 to 188. POPC and UC are represented in line format (cyan). The protein is represented as a Cα backbone tube model except prolines that are spacefilling. The structures are viewed from the terminal overlap domain side of the particle. N-terminal G* domains, residues 1-43 (blue); C-terminal helix 10 domains, residues 220-243, (red); and remainder of protein (gray).

