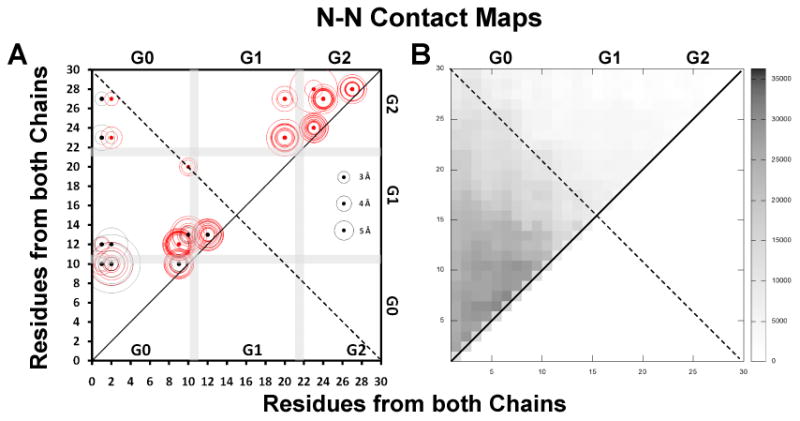
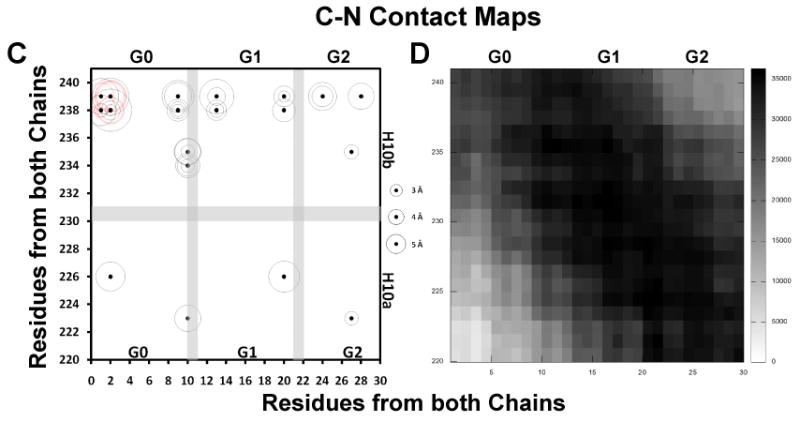
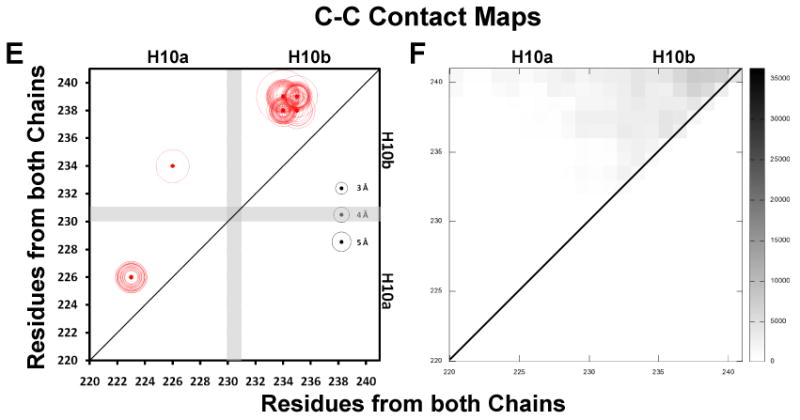
FIGURE 7. Molecular contact maps between N-terminal pairs, C-termini pairs and N-terminal to C-terminal pairs plotted for the R2-216 ensemble of sixteen MDSA simulations of the 160:24:2 (R2-2) particle.


Intermolecular salt bridges are plotted as black dots, intramolecular salt bridges as red dots, other molecular contacts (fraction interhelical contacts close enough to allow cross-linking, defined as a Cα-Cα distance ≤ 25 Å (64), during the last 10 ns of all sixteen R2-216 MDSA trajectories summed over a total of 20,000 frames) are plotted as scaled black rectangles (scale to right of plot). Distances of salt bridges are indicated by circles (scaled to right of plot). A. N-N inter- and intramolecular salt bridges, residues 1-30. B. N-N intermolecular contacts, residues 1-30. C. C-C inter- and intramolecular salt bridges, residues 220-241. D. C-C intermolecular contacts, residues 220-241. E. C-N inter- and intramolecular salt bridges, residues 1-30 to 220-241. F. C-N intermolecular contacts, 1-30 to 220-241.
