
FIGURE 9. Select cross-eyed stereo images of a 240(POPC):36(UC): 2(apoA-I) particle subjected to an MD simulation at 310K for 5 ns and then a T-jump at 500K for 10 ns.
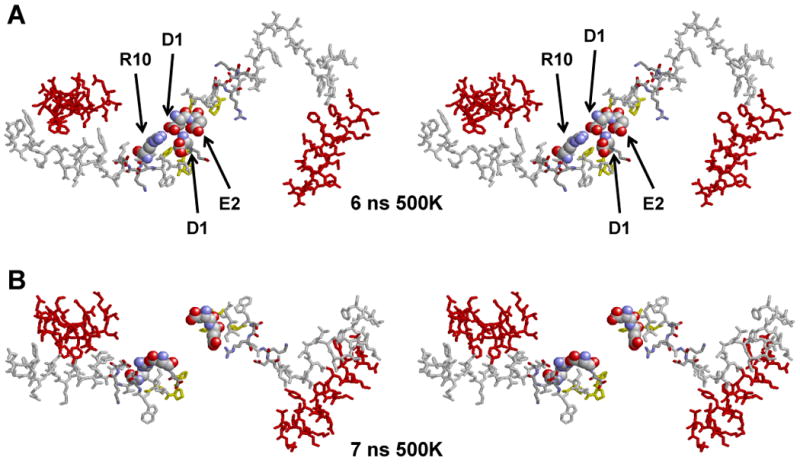
The yellow arrowheads indicate the position of the N-terminal proline-rich domains. A-E. Spacefilling representations of final structures of the following MD simulations: 5 ns at 310K and 1ns, 3 ns, 6 ns and 7 ns at 500K, respectively. Color code: Residues 1-43, white; helix 1 (residues 44-65), blue; helix 5 (residues 120-143), green; helix 8 (residues 187-208), skyblue; helix 10 (residues 220-243), red. F. Stick representations of the final molecular interactions holding the N-termini together in the T-jump simulation at 6 ns. G. Stick representations of the final molecular interactions after separation of the N-termini in the T-jump simulation at 7 ns. The salt bridges between D1 and R10 and E2 and the N-terminal NH3 are shown in spacefilling CPK representation. Color code: residues 1-43, white; helix 10, red; prolines, yellow.