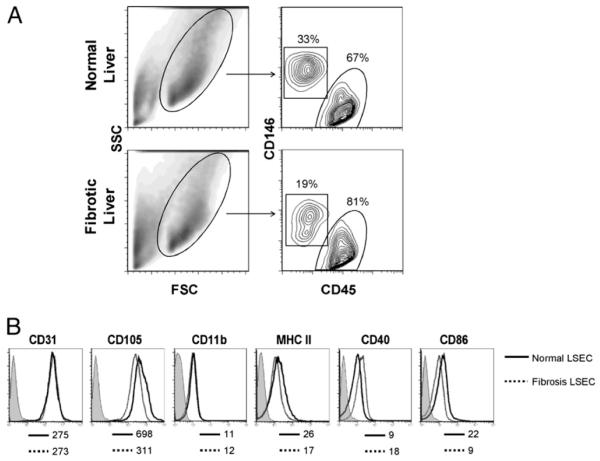
FIGURE 2.
LSEC surface phenotype in fibrosis. A, Live NPCs from normal and fibrotic livers were analyzed for expression of both CD45 and CD146. Dead cells were excluded using 7-aminoactinomycin D (data not shown). B, CD45−CD146+ LSECs were gated and further analyzed for cell surface marker expression. Isotype staining, shown in shaded histograms for N-LSEC, was similar for both groups. Mean fluorescence index is indicated for each marker below their respective histograms. Data are representative of experiments repeated more than three times using three to four mice per experiment. FSC, forward light scatter; SSC, side light scatter.

