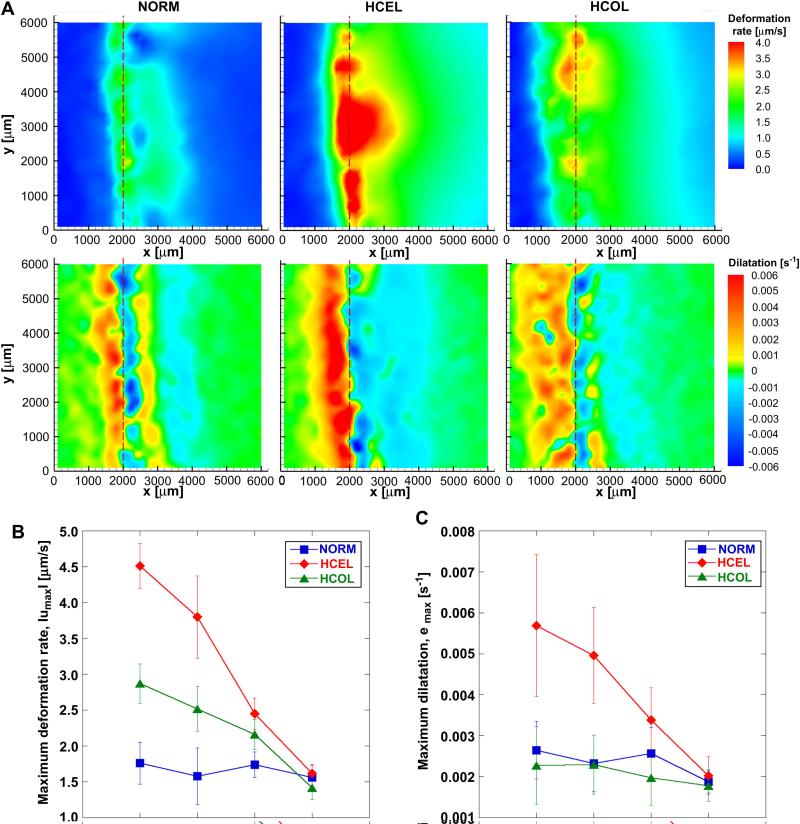
Figure 3.
Freezing-induced local deformation of ETs (n = 3 for each group). (A) Deformation rate and dilatation contours of NORM, HCEL, and HCOL groups, respectively, at X(t) = 2000 μm. All the experimental groups were exposed to an identical F/T condition, but the HCEL and HCOL groups experienced larger deformation than the NORM group. In all groups, a significant local deformation occurs around the phase change interface and propagates along the x-direction. Compared to the NORM group, the magnitudes of the deformation rates of the HCEL and HCOL groups are larger (HCEL > HCOL > NORM), and the area affected by the deformation is much wider than for the NORM group. The magnitude of dilatation for the HCEL group is larger than for the NORM group. As for the HCOL group, the dilatation is similar to that for the NORM group, but the area of dilated frozen region is much wider. The deformation rate and dilatation of the NORM group were re-plotted from [26]. (B) The magnitude of the maximum deformation rate, |umax|, for each experiment group. (C) The magnitude of the maximum and minimum dilatation, emax and emin, for each experimental group. Note that the freezing interface location, X(t), is proportional to .

