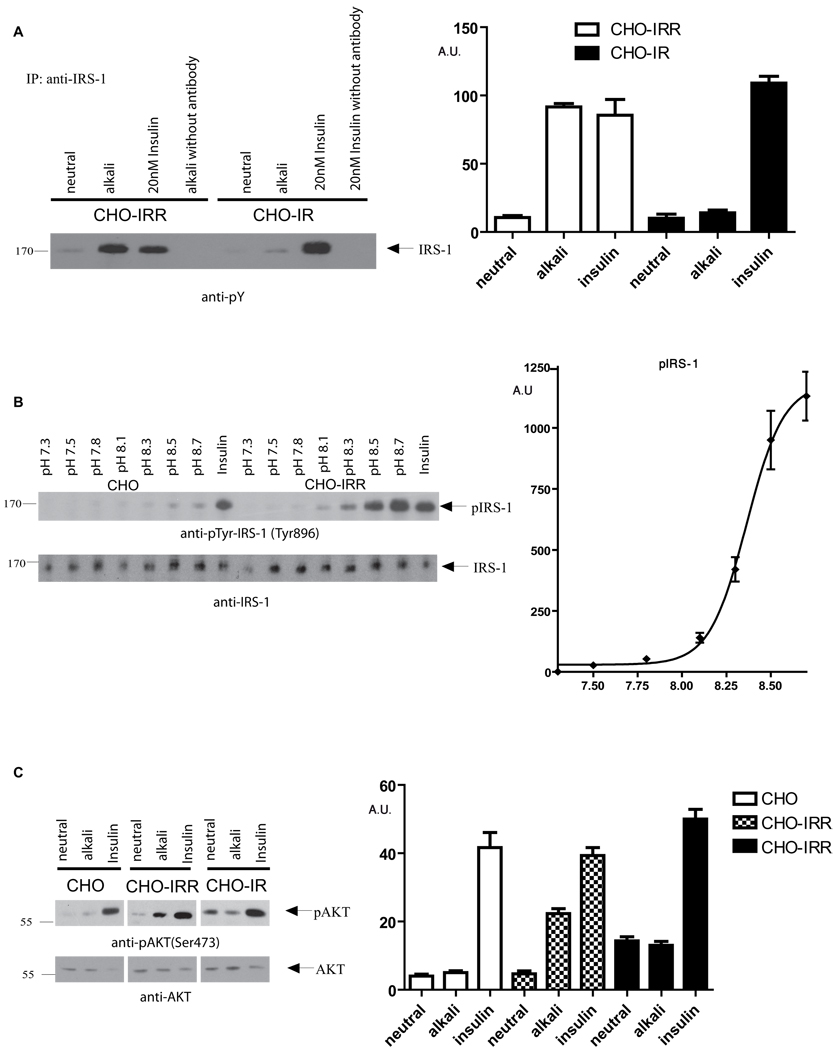
Figure 6. Intracellular cell signaling, triggered by IRR activation.
(A) Phosphorylation of IRS-1 in alkali or insulin-stimulated cell lines. Non-starved IRR and IR-stably transfected cell lines were incubated for 10 min in F12 medium pH 7.4 or 9.0, then lysed and immunoprecipitated with anti-IRS-1 antibody. No antibody was added in the indicated samples as control. The precipitates were analyzed by Western blotting with anti-pY antibody. (B) pH-dependence of IRS-1 signaling. CHO and CHO-IRR cell lines were incubated for 10 min with PBS, adjusted to indicated pH with 60 mM EPPS, or with 20 nM insulin. The lysed cells were Western blotted with anti-pIRS-1 and anti-IRS-1 antibodies. (C) AKT signaling in alkali-stimulated cell lines. CHO, CHO-IRR and IR cells were treated with F-12 pH 7.4, pH 9.0, or with 1µM insulin for 10 min at 37°C. The lysed cells were blotted with anti-pAKT, or anti-AKT antibodies. Original blots representative of 3 independent experiments are shown on left panels. Semi-quantitative densitometry data as in Figure 4 are presented on right panels. The data were normalized by total density (minus background) of each blot. Values are means ± SE. See also Figure S5.

