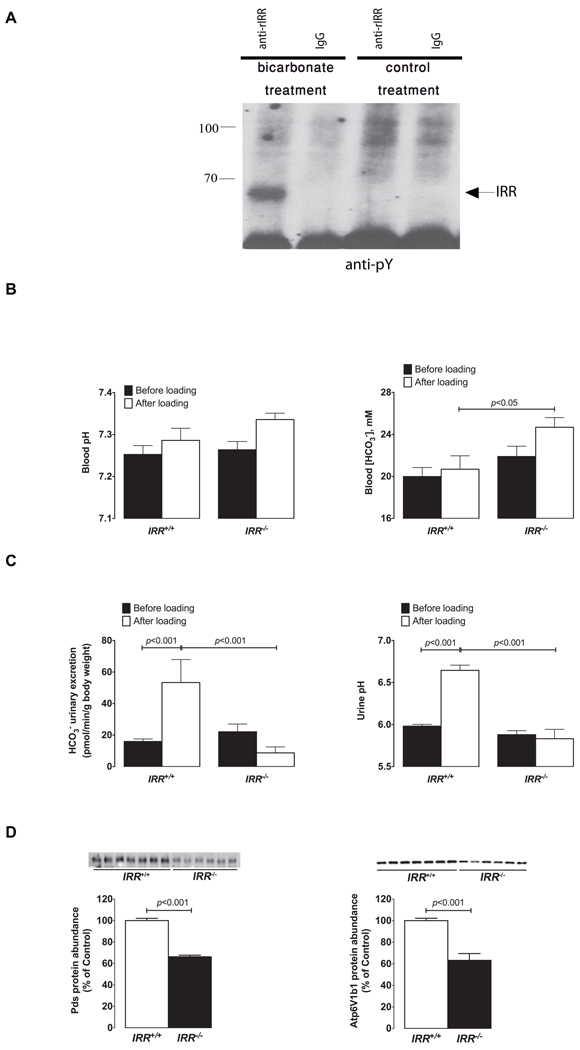
Figure 7. In vivo analyses of IRR function.
(A) Rats were anesthetized, and their kidneys were perfused through renal arteries with 1% solution of NaHCO3 or with 0.9% NaCl (control). The kidneys were then removed and immediately homogenized and extracted, as described in Experimental Procedures. The extracts were immunoprecipitated with affinity purified anti-rat IRR antibody or with the same concentration of rat IgGs as control and analyzed by Western blotting with anti-pY antibody. The blot is representative of three independent experiments. The arrow indicates position of the IRR β-subunit band. (B) Blood gas analyses in IRR+/+ and IRR−/− mice before and after 7 days of alkali-load administered as 0.28M solution of NaHCO3 in the drinking water. (C) Initial renal response to alkali-loading measured in IRR+/+ and IRR−/− mice. Six hours urine collections (from 9h00 a.m. to 3h00 p.m.) were obtained from same IRR+/+ and IRR−/− mice administrated either dionized water on the first day of the experiment (black bars) or NaHCO3 solution on the second day (white bars) to measure urine pH and renal bicarbonate excretion. (D) Immunoblots of membrane fractions from the renal cortex obtained from IRR+/+and IRR−/− mice after 7 days of alkali-loading. The membrane preparations were blotted with antibodies directed against Pds and Atp6v1b1. Densitometric analyses of data show the abundance of Pds, and Atp6v1b1, respectively, expressed as % of control. Equality of loading was verified by running, in parallel, gels that were stained with Coomassie blue and quantified as described previously (Quentin et al., 2004a). Values are means ± SE. See also Figure S6.

