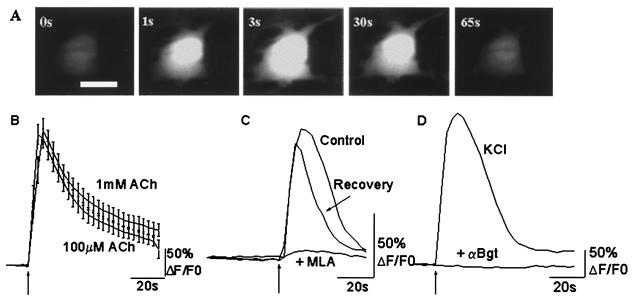
Figure 2.
Calcium responses in astrocytes on activation of nAChRs. (A) Fluo-3 fluorescence of a single astrocyte after a 2-s application of 100 μM ACh. Images shown were acquired before (0 s), and 1 s, 3 s, 30 s, and 65s after ACh application. (Bar = 10 μm.) (B) Averaged calcium transients from 31 cells (1 mM ACh) and 42 (100 μM ACh) fluo-3-loaded astrocytes. The averages are not normalized and represent actual increase in fluorescence above baseline. Similar calcium transients were obtained with both agonist concentrations. (C) Calcium response of an astrocyte in the absence (Control) and presence (+MLA) of 10 nM MLA. The third trace (Recovery) shows the ACh response after a 5-min wash to remove the antagonist. MLA reversibly blocked the ACh response. (D) Changes in calcium transients in presence of 100 nM α-Bgt. Cells were preincubated for 30 min with the toxin before application of 100 μM ACh. The lack of response of an astrocyte to ACh application is shown (lower trace). The upper trace (KCl) shows the response of the same cell to a 2-s application of 75 mM KCl, indicating that calcium responses to other stimuli were unperturbed. Cells were loaded with Fluo-3 acetoxymethyl ester for 30 min before being challenged by the agonist. ACh was applied for 2 s as indicated by the arrows, and the cell was imaged at 0.3 Hz. Atropine (500 nM) was present at all times.

