
Figure 4.
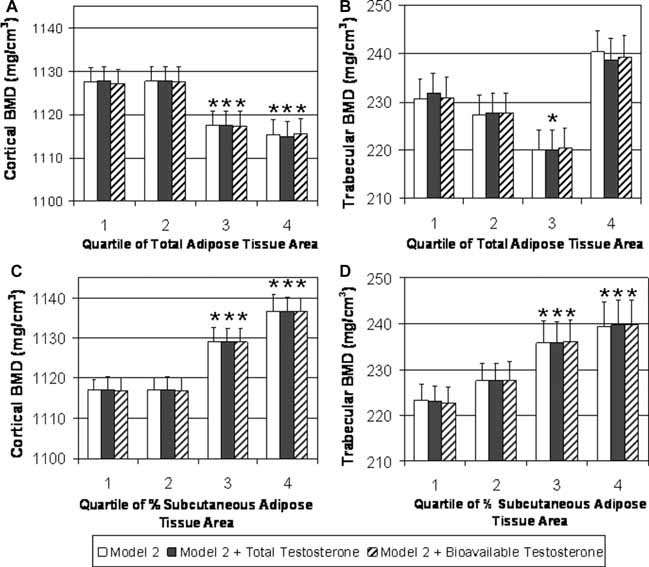
BMD at the tibia by quartile of adipose tissue in testosterone subset. A subset of 447 men had serum total and bioavailable testosterone measurements. Additional adjustment for hormones in a secondary analysis did not attenuate the relationship. (A) Cortical BMD by quartile of total adipose tissue (TAT, mm2) adjusting for age, mixed race, height, and muscle CSA (white bars); total testosterone, age, mixed race, height, and muscle CSA (black bars); and bioavailable testosterone, age, mixed race, height, and muscle CSA (dashed bars). (B) Trabecular BMD by quartile of TAT adjusting for age, mixed race, height, and muscle CSA (white bars); total testosterone, age, mixed race, height, and muscle CSA (black bars); and bioavailable testosterone, age, mixed race, height, and muscle CSA (dashed bars). (C) Cortical BMD by quartile of percent subcutaneous adipose tissue (%SAT) adjusting for age, mixed race, height, and muscle CSA (white bars); total testosterone, age, mixed race, height, and muscle CSA (black bars); and bioavailable testosterone, age, mixed race, height, and muscle CSA (dashed bars). (D) Trabecular BMD by quartile of %SAT adjusting for age, mixed race, height, and muscle CSA (white bars); total testosterone, age, mixed race, height, and muscle CSA (black bars); and bioavailable testosterone, age, mixed race, height, and muscle CSA (dashed bars). Quartile of total adipose tissue was significantly associated with cortical BMD and trabecular BMD (p ≤ .05 for both). Quartile of %SAT was significantly associated with both cortical BMD and trabecular BMD (p < .05 for both). *p < .05 for pairwise comparison with quartile 1 of total adipose tissue area and %SAT.