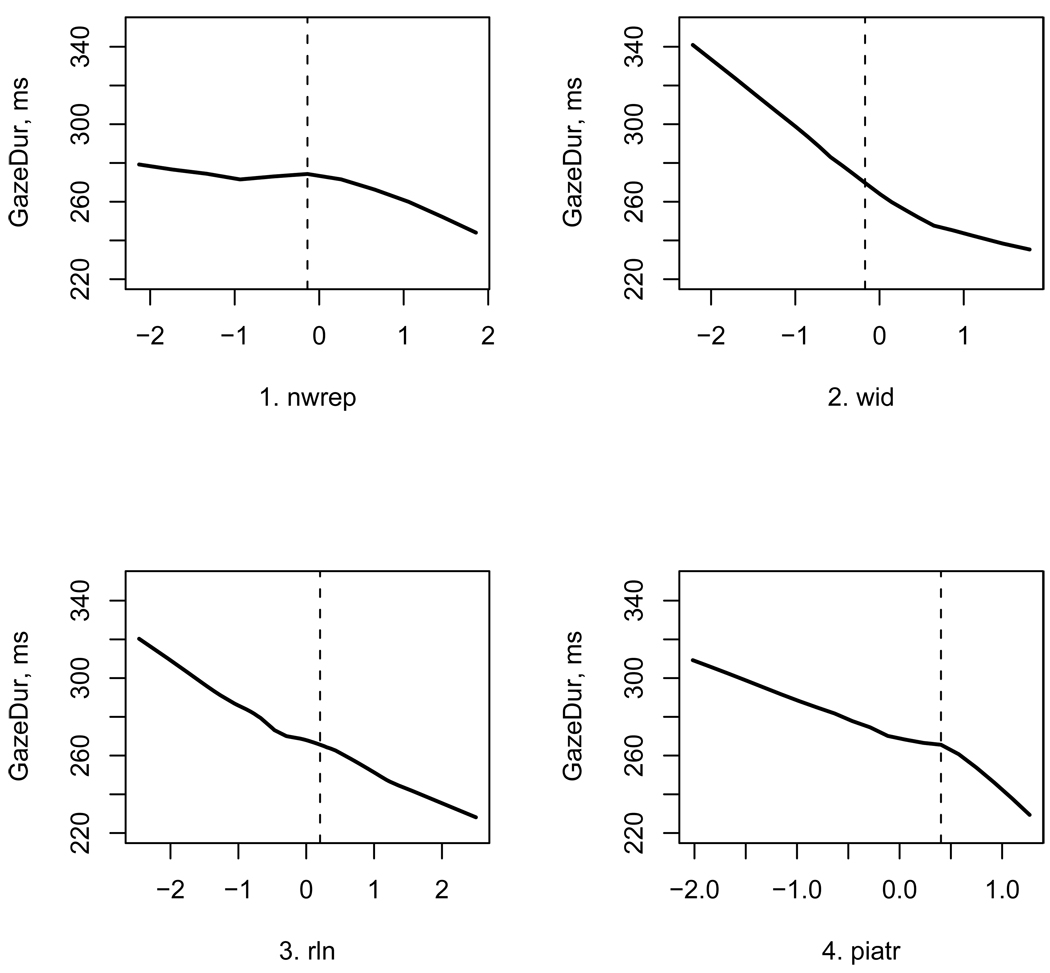
Figure 1.
Scatterplots of gaze duration as a function of the participant scores in (panel 1) the nonword repetition task (nwrep), (panel 2) word identification task (wid), (panel 3) rapid letter naming task (rln), and (panel 4) the Peabody Individual Achievement Test, reading version (piatr). The trend lines are lowess (locally weighted smoother) lines. Vertical dashed lines indicate the median values of respective scores. The scores of nwrep (panel 1) are only predictive of gaze duration for higher scorers, while scores in other tests (panels 2–4) correlate with gaze duration across the entire range of participants.

