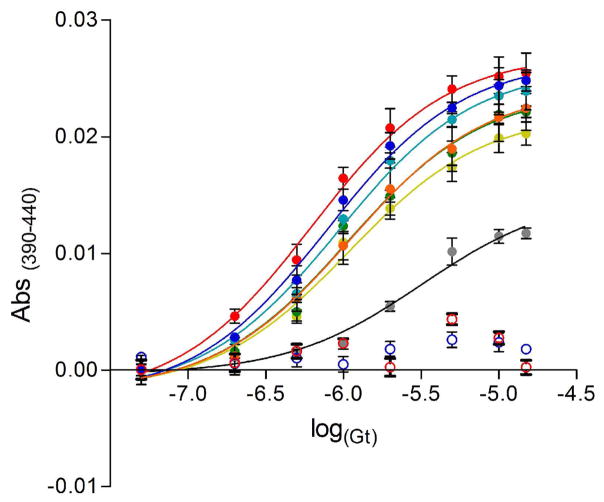
Figure 6.
Effect of negatively charged bicelles on the affinity of Gt for rhodopsin. Concentration-response curves of MII signal stabilized by Gt in the presence of different mixtures of bicelles at a final concentration of 8 % (lipid:rhodopsin ratio of approximately 12800:1). The concentration-response curves were measured at 4 °C and curves are presented for (red) ROS, (empty red circle) ROS + 150 μM GTPγS, (grey) soluble rhodopsin (DDM), (light green) PS (70:30), (green) PS (50:50), (orange) PA (70:30), (light blue) PA+PS (70:30), (dark blue) PA+PS (60:40), (empty dark blue circle) PA+PS (60:40) + 150 μM GTPγS. Solid curves are best fits from a four parameter logistic equation. See Table S2 for estimated EC50 values. Results are mean ± S.E.M. from of at least three independent experiments.

