Figure 8.
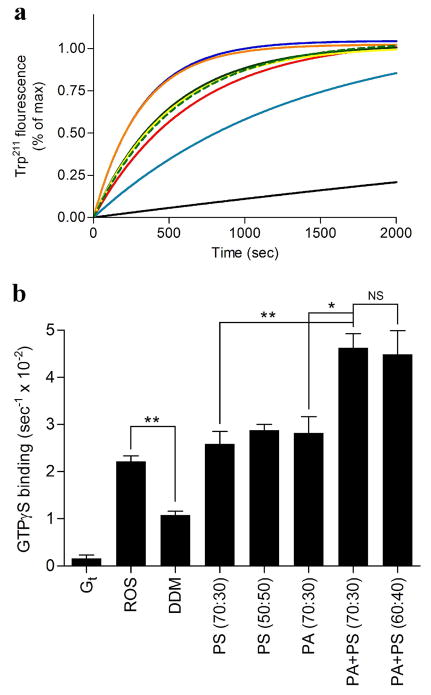
Intrinsic fluorescence changes in Gt. Basal or receptor mediated nucleotide exchange in Gt was measured in the presence or absence of different bicelles as described in the materials and methods section. Final bicelle concentration in each sample is 8% (lipid:rhodopsin ratio of approximately 12800:1). (a) Basal or receptor mediated Trp211 fluorescence change of Gt. Fluorescence curves are presented for Gt in the presence of ROS (red), detergent solubilized rhodopsin (DDM) (teal), Gt alone (black), PS (70:30) (green dash), PS (50:50) (green), PA (70:30) (yellow), PA+PS (70:30) (orange), PA+PS (60:40) (blue). Data were collected at 21 °C for 40 min. (b) Quantitation of the initial rates of basal or rhodopsin-catalyzed nucleotide exchange for Gt. The ratio of neutral to negatively charged phospholipids is indicated within the parentheses in the graph. Results are mean ± S.E.M. values of at least three independent experiments (* p < 0.05; ** p < 0.01; NS, Not Significant).

