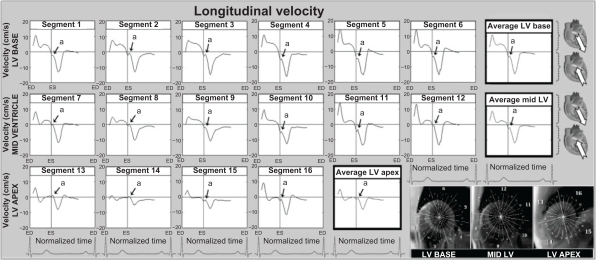
Figure 3.
Longitudinal velocity graphs for individual left ventricular segments (American Heart Association segmentation model) showing the influence of reflected aortic pressure waves on longitudinal motion in early diastole. The graphs represent average values for all volunteers. Positive values correspond to downward motion along the ventricular longitudinal axis (ie, toward the apex), while negative values reflect upward displacement (ie, toward the base). Average velocities for basal, mid, and apical slices are shown in bold outline. The arrows (a) show a brief notch in early diastole corresponding to the expected impact with the reflected wave travelling in an opposite direction. The right lower images show left ventricular short axis images of the base, mid ventricle, and apex, divided into 16 segments, which correspond to the individual left ventricular segments.
Abbreviations: ED, end diastole; ES, end systole; LV, left ventricle.

