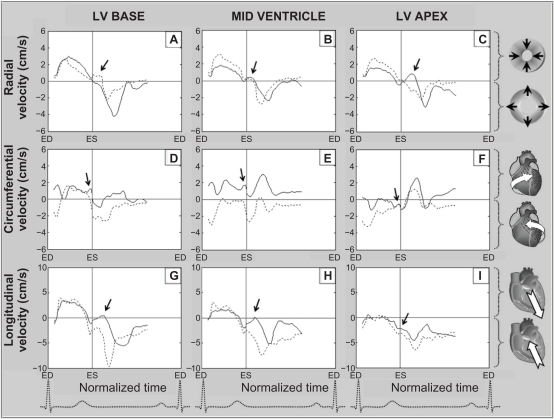
Figure 7.
Radial, circumferential, and longitudinal velocity graphs obtained in a patient with a left ventricular scar (solid line) and in a subject with ischemic heart disease and associated peripheral vascular disease (dotted line). The ventricular base represents average values for segments 1–6, the mid ventricle represents average values for segments 7–12, and the apex represents average values for segments 13–16 (American Heart Association segmentation model). Positive radial velocities show inward motion and negative values show outward motion. Positive circumferential velocities show clockwise rotation and negative values show counterclockwise rotation. Positive longitudinal velocities show downward motion toward the apex, while negative values show upward motion along the ventricular longitudinal axis. Of note is the paradoxical amplification of the early diastolic notch on radial velocity graphs from the ventricular base toward the apex (arrows pointing toward the solid line graph on A = > B = > C), likely representing amplification of reflected wave on scar tissue.
Abbreviations: ED, end diastole; ES, end systole; LV, left ventricle.

