
Fig. 2.
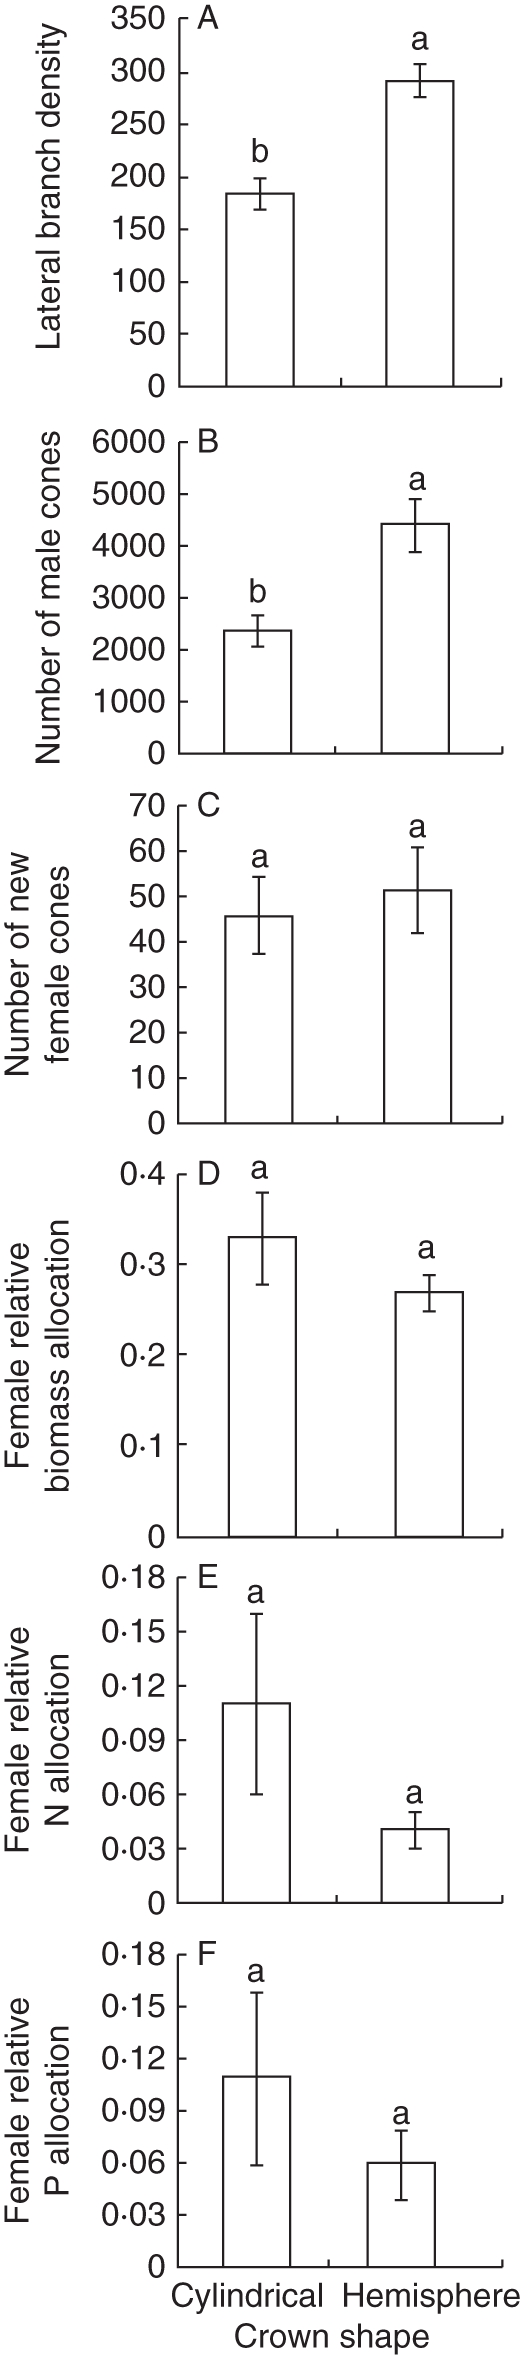
(A) Average (± s.e.) lateral branch density (per m2 of crown area); (B) number of male cones per tree; (C) number of new female cones per tree; (D) biomass allocation to female cones relative to total sex allocation [female/(male + female)]; (E) N allocation to female cones relative to total sex allocation [female/(male + female)]; (F) P allocation to female cones relative to total sex allocation [female/(male + female)], for trees with cylindrical and hemispherical crown shapes. Bars represent the s.e., and different letters indicate significant differences (t-test P < 0·05, n = 10 for each crown shape category).