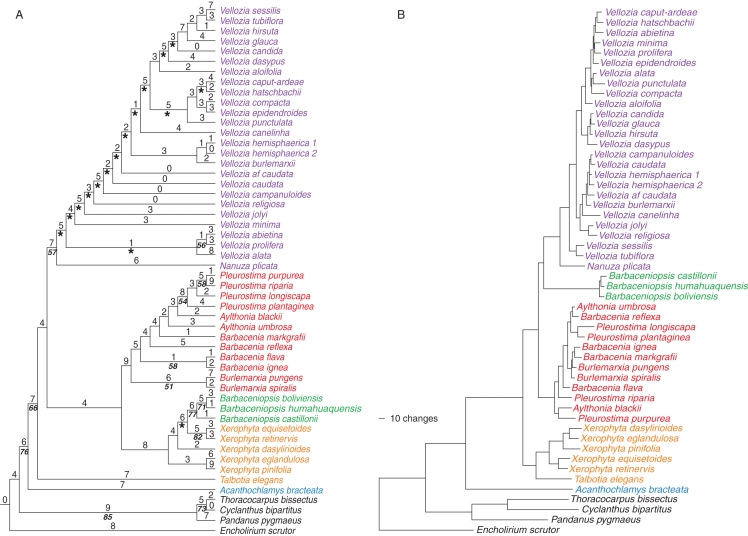
Fig. 1.
(A) Single tree selected from the 697 equally most-parsimonious trees produced from analysis of the morphological data matrix. Numbers above branches are estimated substitutions and numbers below branches are bootstrap percentages. Clades not present in all trees are marked with an asterisk. (B) Single tree selected from the 72 equally most-parsimonious trees produced from a combined matrix of all DNA regions. The length of branches is proportional to substitutions.

