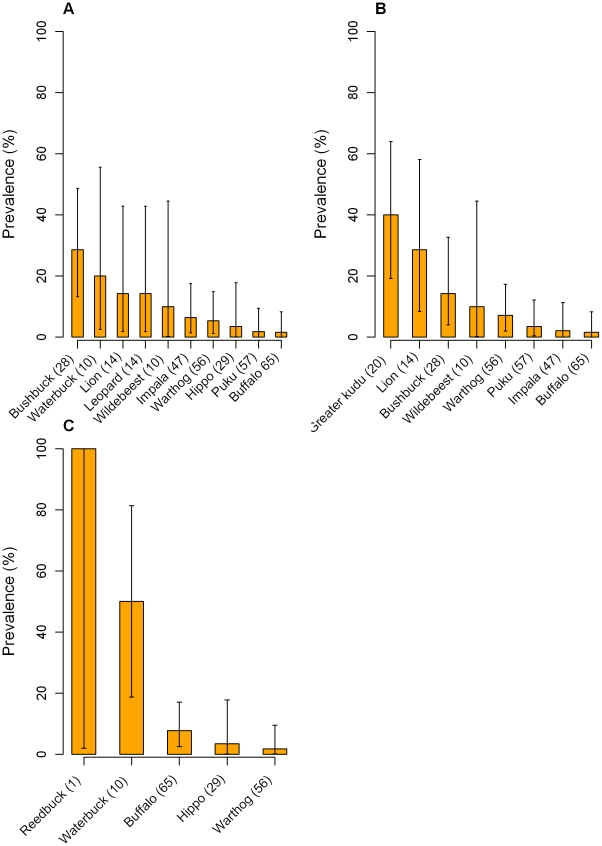
Figure 4. Bar charts of individual trypanosome species prevalence.
Prevalence of (A) T. brucei s.l., (B) T. congolense and (C) T. vivax plotted against wildlife species. Only the species with at least one positive sample are shown in each graph. Error bars represent exact binomial 95% confidence intervals.

