
Figure 6.
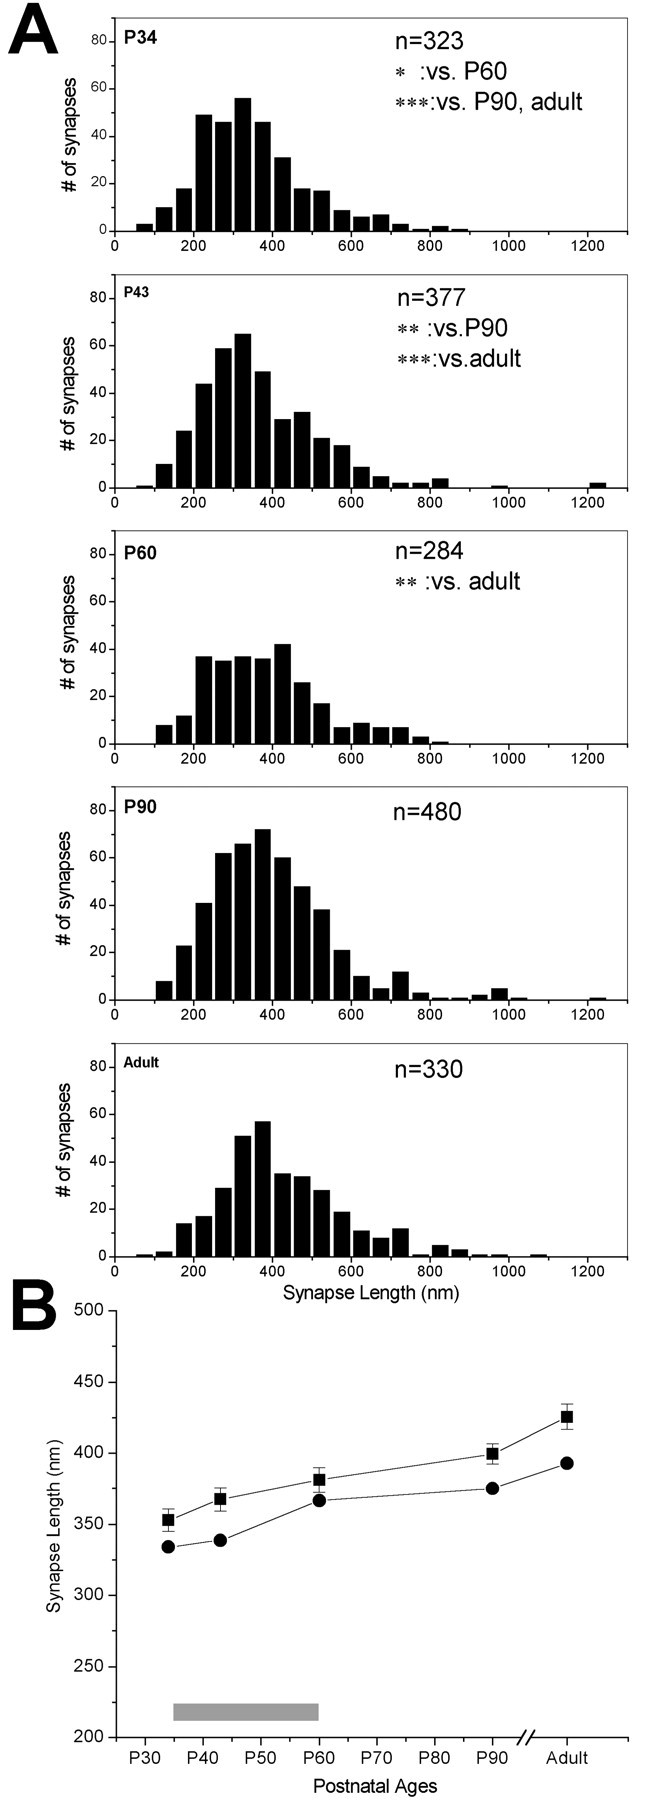
Changes in synaptic length over developmental ages. A, Frequency distribution histograms (black bars) of synaptic length measured in layer 4, at five ages. n values in each panel refer to the number of synapses analyzed at each age. Significance values for Mann-Whitney U comparisons are given in the appropriate panels: *p < 0.01; **p < 0.001; ***p < 0.0001. B, Means (squares; error bars are SE of all synapses measured at each age) and medians (circles) of synaptic lengths at ages corresponding to the critical period of visual cortex plasticity (gray bar over the x-axis, here and in the following figures) and older ages. Note that the critical period in the ferret is determined from data from all of the ages, and the end of the peak of the critical period in layer 4 occurs ∼1 week earlier than it does in all of the layers (Issa et al., 1999).