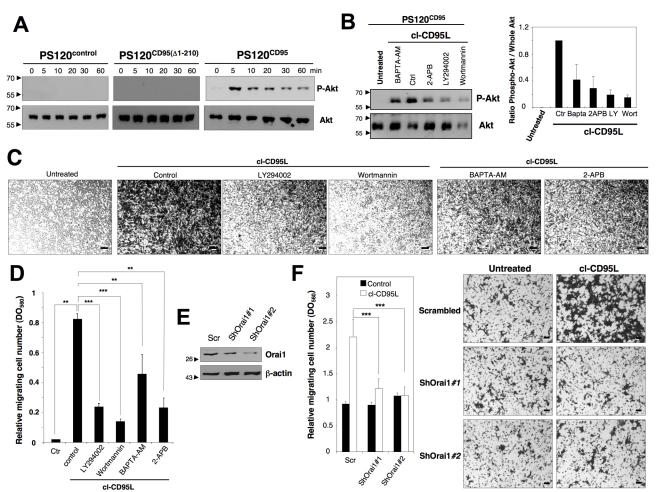
Figure 4. cl-CD95L promotes a cell migration through a Ca2+/PI3K/Akt signal.
(A) The CD95-deficient fibroblastic cell line PS120 transfected with empty vector (PS120control) or reconstituted with either human wild type CD95 (PS120CD95) or a death domain-truncated CD95 (PS120CD95(Δ1-210)) was incubated with 100 ng/ml of cleaved CD95L for indicated times. Cells were harvested, lyzed, and 100 µg of protein was loaded per lane. Proteins were resolved in a SDS-PAGE and immunoblots were performed. Phosphorylation of the serine473 on Akt indicates activation of the kinase. Whole Akt is added as loading control. (B) Upper panels: PS120CD95 cells were pre-incubated with non-cytotoxic and non-cytostatic concentration of PI3K inhibitors (2.5 µM of wortmannin and 5 µM of LY294002), the cell permeant chelator of calcium BAPTA-AM (5 µM), or the inhibitor of IP3-R and SOC channels 2-APB (20 µM). Cells were then untreated (ctr) or treated for 5 min with 100 ng/ml of cl-CD95L and lysed, 50 µg/ml of protein was loaded per lane, and indicated immunoblots were performed. Lower panels: densitometry analyses of the immunoblot bands using ImageJ software and the histograms depict Phospho-Akt/whole Akt ratios. (C) Cell migration of PS120CD95 was assessed using the Boyden chamber assay. Cells were pre-incubated with non-cytotoxic and non-cytostatic concentrations of PI3K inhibitors (2.5 µM of Wortmannin and 5 µM of LY294002), the cell permeant chelator of calcium BAPTA-AM (5 µM), or the inhibitor of SOC channels 2-APB (20 µM) for 30 min and then stimulated with 100 ng/ml of cl-CD95L for 24 h. For each experiment, 10 pictures of the migrating cells were taken and a representative picture was depicted (Bars = 50 µm). (D) Cells were treated as described in (C). To quantitatively measure cell motility, Giemsa-stained migrating cells from the lower side of the membrane were lyzed, and absorbance was measured at a wavelength of 560 nm. Values represent means and SD of three independently performed experiments. **p<0.01 and ***p<0.001 as calculated using two-tailed non-parametric Mann-Whitney test. (E) The silencing effect of the Orai1-targeting shRNAmir-pGIPZ vectors was analyzed by immunoblot in lentiviral-transduced HEK cells. 48 h after transduction, cells were lysed and 100 µg of lysates were loaded per line. β-actin serves as a loading control. (F) Cell migration of indicated shRNAmir-transduced HEK cells was assessed using Boyden chamber assay. Right panels: HEK cells were transduced with scrambled or Orai1-targeting ShRNA, and 48 h later, cells were incubated for 24 h in the presence or absence of 100 ng/ml of cl-CD95L. Migrating cells were fixed with methanol and stained by Giemsa. For each experiment, five pictures of random fields were taken and a representative picture was depicted (Bars = 70 µm). Left panel: To quantitatively measure cell motility, Giemsa-stained migrating cells from the lower side of the membrane were lyzed, and absorbance was measured at a wavelength of 560 nm. Values represent means and SD of three independently performed experiments. *** p<0.001 as calculated using two-tailed non-parametric Mann-Whitney test.

