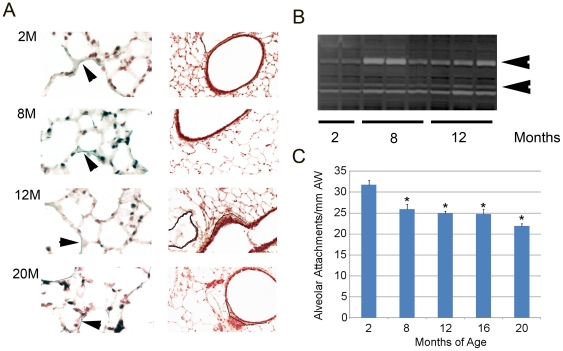
Figure 6. Matrix localization in aging lung.
A. Movat's staining of lungs from mice at designated ages. Left panel shows representative high power (40×) images of lung parenchyma. Right panel shows low power (10×) images of bronchioles. Arrowheads denote sites of elastin deposition (blue-black). Line demarcation indicates areas of enhanced collagen content (yellow). Elastin deposition in the alveolar walls is modestly reduced at 12 months but shows recovered abundance at 20 months. Peribronchiolar collagen deposition is increased in the 12 month and 20 month old lungs. N = 4–6 mice per time point. B. Zymographic analysis of lungs from mice at the designated ages. Top arrow denotes MMP9 band. Bottom arrow denotes MMP2 band. N = 4–6 mice per time point. C. Quantitation of alveolar attachments in the lungs of mice at the designated ages show a progressive reduction in attachments with increasing age. N = 4–6 mice per time point. *p<0.05 compared with 2 months.

