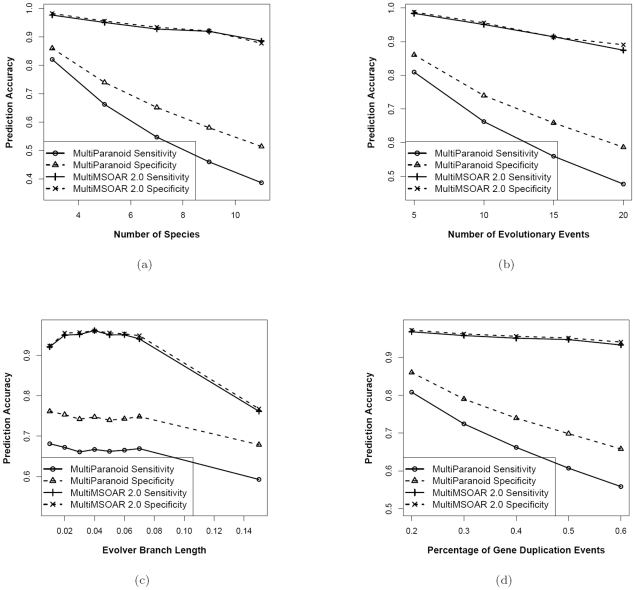
Figure 3. Comparison of MultiMSOAR 2.0 and MultiParanoid on simulated data.
(a) Simulation results on the parameter set  where the parameter
  is varied. (b) Simulation results on the parameter set
  where the parameter
  is varied. (c) Simulation results on the parameter set
  where the parameter
  is varied. (d) Simulation results on the parameter set
  where the parameter
  is varied.

