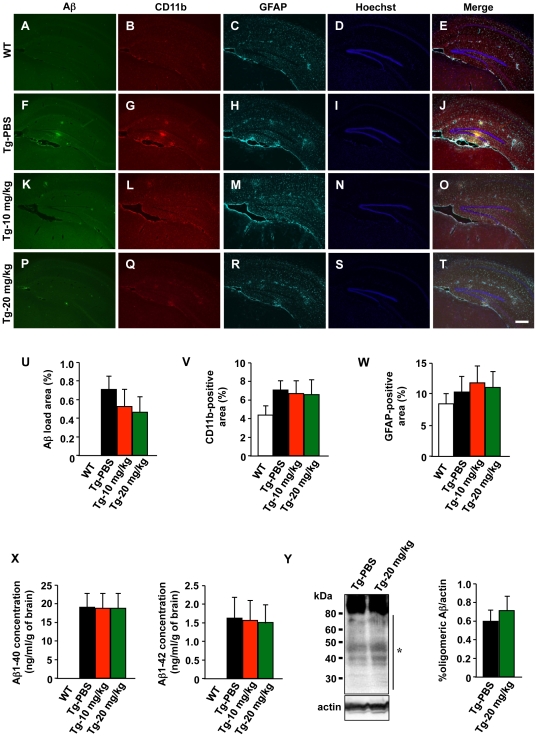
Figure 6. INI-0602 does not affect Aβ deposition or glial activation.
(A–T) Fluorescent microscopic images of hippocampi from 11-month-old APP/PS1 Tg mice. Scale bar, 200 µm. (U–W) Percentage of area occupied by Aß (U), microglia (V), and astrocytes (W). Data represent the means ± SD (n = 6 per group). (X) Human Aß1–40- and Aß1–42-specific ELISAs using homogenized brains from 11-month-old APP/PS1 Tg mice. Data represent the means ± SD (n = 6 per group). (Y) Western blot analysis of oligomeric Aβ extracted from 11-month-old APP/PS1 Tg mice. *, oligomeric Aβ. Data represent the means ± SD (n = 3 per group). WT, wild-type mice; Tg-PBS, PBS-treated Tg mice; Tg-10 mg/kg, 10 mg/kg INI-0602-treated Tg mice; Tg-20 mg/kg, 20 mg/kg INI-0602-treated Tg mice.

