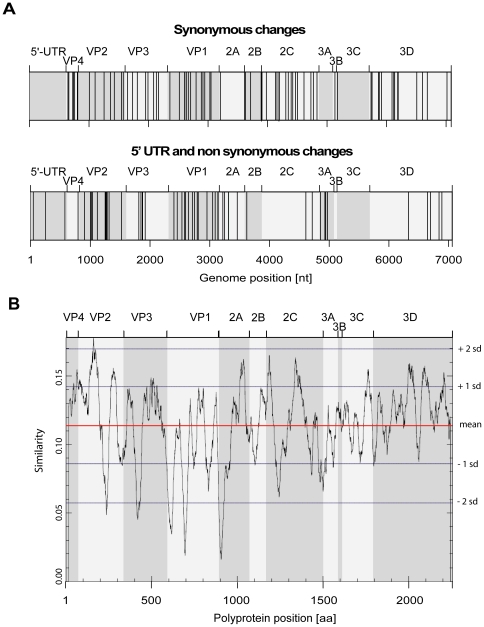
Figure 2. Synonymous and non-synonymous mutation hot spot regions.
A. The synonymous (upper panel), 5′UTR and non-synonymous (lower panel) changes observed between the first and last samples sequenced from patients P37, V38, R58 and F78, as well as between the URT and LRT samples from patient A46, were plotted together along the HRV-2 genome (GenBank accession number X02316) to map mutation hot and cold spot regions. B. The conservation plot was calculated based on an alignment of the amino acid sequence of 99 rhinovirus serotypes and clinical strains as previously published [13]. The average sequence similarity measure for the ORF was 0.114 (red line). sd: standard deviation.

