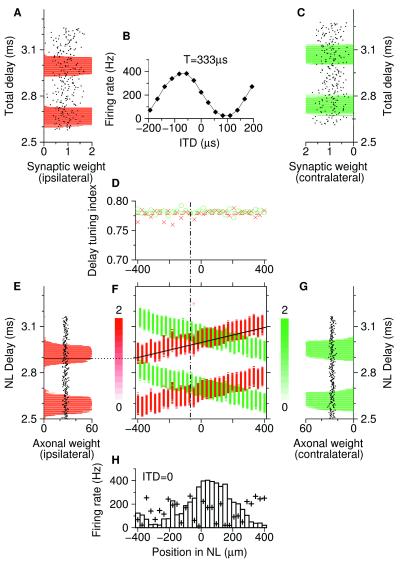
Figure 3.
Map of ITD-tuned neurons in the laminar nucleus (NL). Ipsi- and contralateral synaptic weights after learning are coded by red and green, respectively. (A) Ipsilateral weights of a single laminar neuron (abscissa) are plotted as a function of the transmission delay (ordinate) from the ear to the synapse, called total delay. Dots denote initial weights before learning. (B) ITD-tuning curve of the neuron in A and C. (C) Same as A but for contralateral afferents. Note the shift of the distribution compared with A. (D) Ipsilateral (crosses) and contralateral (circles) tuning indices of the distributions of total delays (see Methods) as a function of the neuron's spatial position (same scale as in H). Horizontal dashed lines denote mean values. The vertical dot-dashed line indicates the position of the neuron shown in A–C. (E) Distribution of ipsilateral axonal weights (abscissa) as a function of the transmission delay (ordinate) from the ear to the dorsal NL border (NL delay). Dots denote initial weights before learning. (F) Synaptic weights (brightness-coded, scale bars in units of synaptic weights) are a function of the position of the neuron inside NL (abscissa, same scale as in D and H) and of the total delay to a neuron (ordinate, same scale as in E and G). Weights of a specific ipsilateral arbor are represented by the diagonal solid black line with slope 4 m/s, the axonal conduction velocity. Summing synaptic weights along this line, we obtain an axonal weight (horizontal black bar in E). (G) Same as E but for contralateral axons. (H) Dependence of firing rate of laminaris neurons for ITD = 0 on their location (histogram). The maximum firing rate is where the overlap of delay distributions in F is largest. Plus signs indicate rates for ρ = 0 in Fig. 4B; there is no map.

