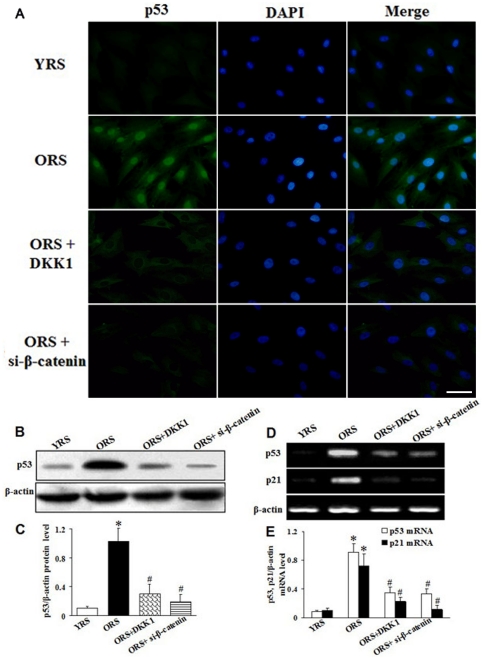
Figure 12. Effects of Wnt/β-catenin signaling on p53 and p21 expression.
(A) Immunofluorescence staining of p53. p53 expression was hardly detected in the YRS group, whereas the ORS group showed an obvious increase in p53 expression. p53 expression was decreased after treatment with DKK1 or si-β-catenin to inhibit Wnt/β-catenin signaling. Green, p53; blue, DAPI. Scale bar = 25 µm. (B) Western blot analysis of p53 protein expression. β-Actin was used as the internal control. (C) Quantification of p53 protein levels. The p53 expression level was clearly higher in the ORS group than that in the YRS group (*P<0.01). In the ORS + DKK1 and ORS + si-β-catenin groups, the p53 expression level was evidently lower than in the ORS group (# P<0.01; n = 5). (D) The expression of p53 and p21 were assessed using RT-PCR. β-Actin was used as the internal control. (E) Quantification of p53 and p21 mRNA level, normalized with β-actin mRNA level. The results show there was a clear upregulation of p53 and p21 mRNA expression in the ORS group compared with that in the YRS group (*P<0.01). After treatment with DKK1 or si-β-catenin to inhibit Wnt/β-catenin signaling in ORS, p53 and p21 expression was significantly decreased compared with that in the ORS group (# P<0.01; n = 5).

